

About the Execution of Tapaal for HouseConstruction-PT-050
| Execution Summary | |||||
| Max Memory Used (MB) |
Time wait (ms) | CPU Usage (ms) | I/O Wait (ms) | Computed Result | Execution Status |
| 14337.490 | 2359581.00 | 2790011.00 | 1067.60 | F?T?F??T?T?TF?TF | normal |
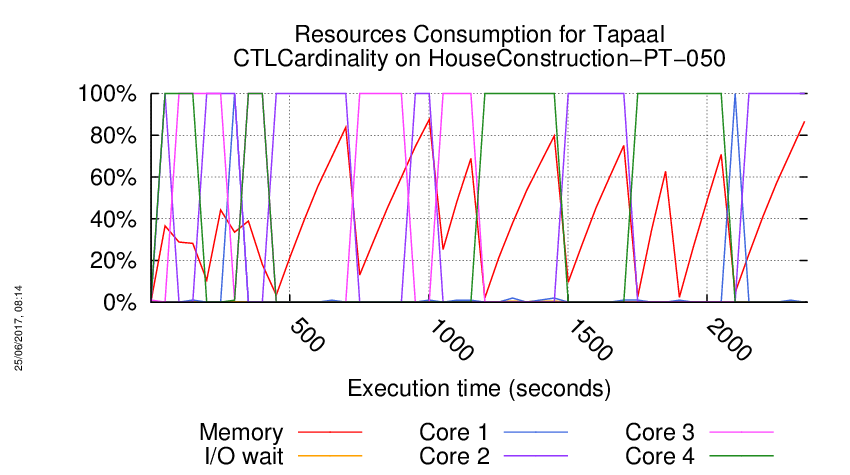
Execution Chart
We display below the execution chart for this examination (boot time has been removed).
Trace from the execution
Waiting for the VM to be ready (probing ssh)
......
=====================================================================
Generated by BenchKit 2-3254
Executing tool tapaal
Input is HouseConstruction-PT-050, examination is CTLCardinality
Time confinement is 3600 seconds
Memory confinement is 16384 MBytes
Number of cores is 4
Run identifier is r029-blw3-149440265900606
=====================================================================
--------------------
content from stdout:
=== Data for post analysis generated by BenchKit (invocation template)
The expected result is a vector of booleans
BOOL_VECTOR
here is the order used to build the result vector(from text file)
FORMULA_NAME HouseConstruction-PT-050-CTLCardinality-0
FORMULA_NAME HouseConstruction-PT-050-CTLCardinality-1
FORMULA_NAME HouseConstruction-PT-050-CTLCardinality-10
FORMULA_NAME HouseConstruction-PT-050-CTLCardinality-11
FORMULA_NAME HouseConstruction-PT-050-CTLCardinality-12
FORMULA_NAME HouseConstruction-PT-050-CTLCardinality-13
FORMULA_NAME HouseConstruction-PT-050-CTLCardinality-14
FORMULA_NAME HouseConstruction-PT-050-CTLCardinality-15
FORMULA_NAME HouseConstruction-PT-050-CTLCardinality-2
FORMULA_NAME HouseConstruction-PT-050-CTLCardinality-3
FORMULA_NAME HouseConstruction-PT-050-CTLCardinality-4
FORMULA_NAME HouseConstruction-PT-050-CTLCardinality-5
FORMULA_NAME HouseConstruction-PT-050-CTLCardinality-6
FORMULA_NAME HouseConstruction-PT-050-CTLCardinality-7
FORMULA_NAME HouseConstruction-PT-050-CTLCardinality-8
FORMULA_NAME HouseConstruction-PT-050-CTLCardinality-9
=== Now, execution of the tool begins
BK_START 1494812179343
---> tapaal --- TAPAAL
Total timeout: 3600
*************************************
* TAPAAL verifying CTLCardinality *
*************************************
---------------------------------------------------
Step 1: Parallel processing
---------------------------------------------------
Doing parallel verification of individual queries (16 in total)
Each query is verified by 2 parallel strategies for 60 seconds
------------------- QUERY 1 ----------------------
Solution found
Parameters: -s DFS -q 0 -d 10 ./model.pnml ./CTLCardinality.xml -x 1
Parameters: -s DFS -d 10 ./model.pnml ./CTLCardinality.xml -x 1
Search=DFS,Trace=DISABLED,State_Space_Exploration=DISABLED,Structural_Reduction=AGGRESSIVE,Struct_Red_Timout=10,Stubborn_Reduction=ENABLED,Query_Simplication=DISABLED,Siphon_Trap=DISABLED,LPSolve_Timeout=10
Query is NOT satisfied.
STATS:
Time (seconds): 0.003979
Configurations: 2288
Markings: 2284
Edges: 954
Processed Edges: 1902
Processed N. Edges: 4
Explored Configs: 954
Query: !(AF!(AF!(tokens-count(p7) le tokens-count(p12))))
parallel: This job succeeded:
/home/mcc/BenchKit/start.sh 14500000 /home/mcc/BenchKit/bin/verifypn-linux64 -s\ DFS\ -q\ 0\ -d\ 10 ./model.pnml ./CTLCardinality.xml -x 1
FORMULA HouseConstruction-PT-050-CTLCardinality-0 FALSE TECHNIQUES COLLATERAL_PROCESSING EXPLICIT STRUCTURAL_REDUCTION STATE_COMPRESSION STUBBORN_SETS
------------------- QUERY 2 ----------------------
No solution found
Parameters: -s DFS -d 10 ./model.pnml ./CTLCardinality.xml -x 2
Parameters: -s DFS -q 0 -d 10 ./model.pnml ./CTLCardinality.xml -x 2
------------------- QUERY 3 ----------------------
No solution found
Parameters: -s DFS -d 10 ./model.pnml ./CTLCardinality.xml -x 3
Parameters: -s DFS -q 0 -d 10 ./model.pnml ./CTLCardinality.xml -x 3
------------------- QUERY 4 ----------------------
Solution found
Parameters: -s DFS -d 10 ./model.pnml ./CTLCardinality.xml -x 4
Parameters: -s DFS -q 0 -d 10 ./model.pnml ./CTLCardinality.xml -x 4
Search=DFS,Trace=DISABLED,State_Space_Exploration=DISABLED,Structural_Reduction=AGGRESSIVE,Struct_Red_Timout=10,Stubborn_Reduction=ENABLED,Query_Simplication=ENABLED,QSTimeout=30,Siphon_Trap=DISABLED,LPSolve_Timeout=10
Query before reduction: EG EF ((p12 <= p6) and (p8 <= p8))
Query after reduction: EG EF (p12 <= p6)
Query size reduced from 9 to 5 nodes (44.44 percent reduction).
Query reduction finished after 0.000477 seconds.
Query is satisfied.
STATS:
Time (seconds): 1.284
Configurations: 543637
Markings: 541537
Edges: 1344754
Processed Edges: 1885353
Processed N. Edges: 2604
Explored Configs: 542304
Query: !(AF!(EFtokens-count(p12) le tokens-count(p6)))
Search=DFS,Trace=DISABLED,State_Space_Exploration=DISABLED,Structural_Reduction=AGGRESSIVE,Struct_Red_Timout=10,Stubborn_Reduction=ENABLED,Query_Simplication=DISABLED,Siphon_Trap=DISABLED,LPSolve_Timeout=10
Query is satisfied.
STATS:
Time (seconds): 1.288
Configurations: 543637
Markings: 541537
Edges: 1344754
Processed Edges: 1885353
Processed N. Edges: 2604
Explored Configs: 542304
Query: !(AF!(EF(tokens-count(p12) le tokens-count(p6) & tokens-count(p8) le tokens-count(p8))))
parallel: This job succeeded:
/home/mcc/BenchKit/start.sh 14500000 /home/mcc/BenchKit/bin/verifypn-linux64 -s\ DFS\ -q\ 0\ -d\ 10 ./model.pnml ./CTLCardinality.xml -x 4
FORMULA HouseConstruction-PT-050-CTLCardinality-3 TRUE TECHNIQUES COLLATERAL_PROCESSING EXPLICIT STRUCTURAL_REDUCTION STATE_COMPRESSION STUBBORN_SETS
------------------- QUERY 5 ----------------------
No solution found
Parameters: -s DFS -d 10 ./model.pnml ./CTLCardinality.xml -x 5
Parameters: -s DFS -q 0 -d 10 ./model.pnml ./CTLCardinality.xml -x 5
------------------- QUERY 6 ----------------------
Solution found
Parameters: -s DFS -d 10 ./model.pnml ./CTLCardinality.xml -x 6
Parameters: -s DFS -q 0 -d 10 ./model.pnml ./CTLCardinality.xml -x 6
Search=DFS,Trace=DISABLED,State_Space_Exploration=DISABLED,Structural_Reduction=AGGRESSIVE,Struct_Red_Timout=10,Stubborn_Reduction=ENABLED,Query_Simplication=ENABLED,QSTimeout=30,Siphon_Trap=DISABLED,LPSolve_Timeout=10
Query before reduction: EG (not (not (not (2 <= p5))))
Query after reduction: EG (2 > p5)
Query size reduced from 4 to 4 nodes (0.00 percent reduction).
Query reduction finished after 0.000455 seconds.
Query is satisfied.
STATS:
Time (seconds): 0.004048
Configurations: 2235
Markings: 2234
Edges: 901
Processed Edges: 1800
Processed N. Edges: 2
Explored Configs: 902
Query: !(AF!(integer-constant(2) gr tokens-count(p5)))
parallel: This job succeeded:
/home/mcc/BenchKit/start.sh 7250000 /home/mcc/BenchKit/bin/verifypn-linux64 -s\ DFS\ -d\ 10 ./model.pnml ./CTLCardinality.xml -x 6
FORMULA HouseConstruction-PT-050-CTLCardinality-5 TRUE TECHNIQUES COLLATERAL_PROCESSING EXPLICIT STRUCTURAL_REDUCTION STATE_COMPRESSION STUBBORN_SETS
------------------- QUERY 7 ----------------------
Solution found
Parameters: -s DFS -d 10 ./model.pnml ./CTLCardinality.xml -x 7
Parameters: -s DFS -q 0 -d 10 ./model.pnml ./CTLCardinality.xml -x 7
Search=DFS,Trace=DISABLED,State_Space_Exploration=DISABLED,Structural_Reduction=AGGRESSIVE,Struct_Red_Timout=10,Stubborn_Reduction=ENABLED,Query_Simplication=ENABLED,QSTimeout=30,Siphon_Trap=DISABLED,LPSolve_Timeout=10
Query before reduction: AF (not ((not (p5 <= p11)) or ((p3 <= p27) or (p11 <= p10))))
Query after reduction: AF ((p5 <= p11) and ((p3 > p27) and (p11 > p10)))
Query size reduced from 12 to 12 nodes (0.00 percent reduction).
Query reduction finished after 0.001372 seconds.
Query is NOT satisfied.
STATS:
Time (seconds): 0.00403
Configurations: 2234
Markings: 2234
Edges: 900
Processed Edges: 1800
Processed N. Edges: 0
Explored Configs: 901
Query: AF(tokens-count(p5) le tokens-count(p11) & (tokens-count(p3) gr tokens-count(p27) & tokens-count(p11) gr tokens-count(p10)))
parallel: This job succeeded:
/home/mcc/BenchKit/start.sh 7250000 /home/mcc/BenchKit/bin/verifypn-linux64 -s\ DFS\ -d\ 10 ./model.pnml ./CTLCardinality.xml -x 7
FORMULA HouseConstruction-PT-050-CTLCardinality-6 FALSE TECHNIQUES COLLATERAL_PROCESSING EXPLICIT STRUCTURAL_REDUCTION STATE_COMPRESSION STUBBORN_SETS
------------------- QUERY 8 ----------------------
No solution found
Parameters: -s DFS -d 10 ./model.pnml ./CTLCardinality.xml -x 8
Parameters: -s DFS -q 0 -d 10 ./model.pnml ./CTLCardinality.xml -x 8
------------------- QUERY 9 ----------------------
Solution found
Parameters: -s DFS -d 10 ./model.pnml ./CTLCardinality.xml -x 9
Parameters: -s DFS -q 0 -d 10 ./model.pnml ./CTLCardinality.xml -x 9
Search=DFS,Trace=DISABLED,State_Space_Exploration=DISABLED,Structural_Reduction=AGGRESSIVE,Struct_Red_Timout=10,Stubborn_Reduction=ENABLED,Query_Simplication=DISABLED,Siphon_Trap=DISABLED,LPSolve_Timeout=10
Query is satisfied.
STATS:
Time (seconds): 0.004009
Configurations: 2237
Markings: 2234
Edges: 903
Processed Edges: 1802
Processed N. Edges: 2
Explored Configs: 903
Query: (A((integer-constant(2) le tokens-count(p3) & tokens-count(p16) le tokens-count(p23))) U ((integer-constant(3) le tokens-count(p25) | integer-constant(1) le tokens-count(p5))) | !(AF!((!(integer-constant(2) le tokens-count(p26)) | !(integer-constant(3) le tokens-count(p5))))))
Search=DFS,Trace=DISABLED,State_Space_Exploration=DISABLED,Structural_Reduction=AGGRESSIVE,Struct_Red_Timout=10,Stubborn_Reduction=ENABLED,Query_Simplication=ENABLED,QSTimeout=30,Siphon_Trap=DISABLED,LPSolve_Timeout=10
Query before reduction: (A (((2 <= p3) and (p16 <= p23)) U ((3 <= p25) or (1 <= p5))) or EG ((not (2 <= p26)) or (not (3 <= p5))))
Query after reduction: (A (((2 <= p3) and (p16 <= p23)) U ((3 <= p25) or (1 <= p5))) or EG ((2 > p26) or (3 > p5)))
Query size reduced from 24 to 24 nodes (0.00 percent reduction).
Query reduction finished after 0.002095 seconds.
Query is satisfied.
STATS:
Time (seconds): 0.004017
Configurations: 2237
Markings: 2234
Edges: 903
Processed Edges: 1802
Processed N. Edges: 2
Explored Configs: 903
Query: (A((integer-constant(2) le tokens-count(p3) & tokens-count(p16) le tokens-count(p23))) U ((integer-constant(3) le tokens-count(p25) | integer-constant(1) le tokens-count(p5))) | !(AF!((integer-constant(2) gr tokens-count(p26) | integer-constant(3) gr tokens-count(p5)))))
parallel: This job succeeded:
/home/mcc/BenchKit/start.sh 7250000 /home/mcc/BenchKit/bin/verifypn-linux64 -s\ DFS\ -d\ 10 ./model.pnml ./CTLCardinality.xml -x 9
parallel: This job succeeded:
/home/mcc/BenchKit/start.sh 14500000 /home/mcc/BenchKit/bin/verifypn-linux64 -s\ DFS\ -q\ 0\ -d\ 10 ./model.pnml ./CTLCardinality.xml -x 9
FORMULA HouseConstruction-PT-050-CTLCardinality-8 TRUE TECHNIQUES COLLATERAL_PROCESSING EXPLICIT STRUCTURAL_REDUCTION STATE_COMPRESSION STUBBORN_SETS
------------------- QUERY 10 ----------------------
Solution found
Parameters: -s DFS -d 10 ./model.pnml ./CTLCardinality.xml -x 10
Parameters: -s DFS -q 0 -d 10 ./model.pnml ./CTLCardinality.xml -x 10
Search=DFS,Trace=DISABLED,State_Space_Exploration=DISABLED,Structural_Reduction=AGGRESSIVE,Struct_Red_Timout=10,Stubborn_Reduction=ENABLED,Query_Simplication=ENABLED,QSTimeout=30,Siphon_Trap=DISABLED,LPSolve_Timeout=10
Query before reduction: A (EF (3 <= p21) U EG (p6 <= p22))
Query after reduction: A (EF (3 <= p21) U EG (p6 <= p22))
Query size reduced from 9 to 9 nodes (0.00 percent reduction).
Query reduction finished after 0.000764 seconds.
Query is NOT satisfied.
STATS:
Time (seconds): 3.932
Configurations: 1487491
Markings: 1470651
Edges: 1519283
Processed Edges: 2973559
Processed N. Edges: 3432
Explored Configs: 1468604
Query: A(EFinteger-constant(3) le tokens-count(p21)) U (!(AF!(tokens-count(p6) le tokens-count(p22))))
Search=DFS,Trace=DISABLED,State_Space_Exploration=DISABLED,Structural_Reduction=AGGRESSIVE,Struct_Red_Timout=10,Stubborn_Reduction=ENABLED,Query_Simplication=DISABLED,Siphon_Trap=DISABLED,LPSolve_Timeout=10
Query is NOT satisfied.
STATS:
Time (seconds): 4.032
Configurations: 1487491
Markings: 1470651
Edges: 1519283
Processed Edges: 2973559
Processed N. Edges: 3432
Explored Configs: 1468604
Query: A(EFinteger-constant(3) le tokens-count(p21)) U (!(AF!(tokens-count(p6) le tokens-count(p22))))
parallel: This job succeeded:
/home/mcc/BenchKit/start.sh 7250000 /home/mcc/BenchKit/bin/verifypn-linux64 -s\ DFS\ -d\ 10 ./model.pnml ./CTLCardinality.xml -x 10
FORMULA HouseConstruction-PT-050-CTLCardinality-9 FALSE TECHNIQUES COLLATERAL_PROCESSING EXPLICIT STRUCTURAL_REDUCTION STATE_COMPRESSION STUBBORN_SETS
------------------- QUERY 11 ----------------------
Solution found
Parameters: -s DFS -d 10 ./model.pnml ./CTLCardinality.xml -x 11
Parameters: -s DFS -q 0 -d 10 ./model.pnml ./CTLCardinality.xml -x 11
Search=DFS,Trace=DISABLED,State_Space_Exploration=DISABLED,Structural_Reduction=AGGRESSIVE,Struct_Red_Timout=10,Stubborn_Reduction=ENABLED,Query_Simplication=ENABLED,QSTimeout=30,Siphon_Trap=DISABLED,LPSolve_Timeout=10
Query before reduction: AX EF (3 <= p25)
Query after reduction: AX EF (3 <= p25)
Query size reduced from 5 to 5 nodes (0.00 percent reduction).
Query reduction finished after 0.000420 seconds.
Query is satisfied.
STATS:
Time (seconds): 0.009307
Configurations: 3730
Markings: 3730
Edges: 7043
Processed Edges: 8106
Processed N. Edges: 0
Explored Configs: 2399
Query: AXEFinteger-constant(3) le tokens-count(p25)
parallel: This job succeeded:
/home/mcc/BenchKit/start.sh 7250000 /home/mcc/BenchKit/bin/verifypn-linux64 -s\ DFS\ -d\ 10 ./model.pnml ./CTLCardinality.xml -x 11
FORMULA HouseConstruction-PT-050-CTLCardinality-10 TRUE TECHNIQUES COLLATERAL_PROCESSING EXPLICIT STRUCTURAL_REDUCTION STATE_COMPRESSION STUBBORN_SETS
------------------- QUERY 12 ----------------------
No solution found
Parameters: -s DFS -d 10 ./model.pnml ./CTLCardinality.xml -x 12
Parameters: -s DFS -q 0 -d 10 ./model.pnml ./CTLCardinality.xml -x 12
------------------- QUERY 13 ----------------------
Solution found
Parameters: -s DFS -d 10 ./model.pnml ./CTLCardinality.xml -x 13
Parameters: -s DFS -q 0 -d 10 ./model.pnml ./CTLCardinality.xml -x 13
Search=DFS,Trace=DISABLED,State_Space_Exploration=DISABLED,Structural_Reduction=AGGRESSIVE,Struct_Red_Timout=10,Stubborn_Reduction=ENABLED,Query_Simplication=ENABLED,QSTimeout=30,Siphon_Trap=DISABLED,LPSolve_Timeout=10
Query before reduction: (not (not A ((p8 <= p8) U (2 <= p22))))
Query after reduction: AF (2 <= p22)
Query size reduced from 7 to 4 nodes (42.86 percent reduction).
Query reduction finished after 0.000461 seconds.
Query is NOT satisfied.
STATS:
Time (seconds): 0.003953
Configurations: 2234
Markings: 2234
Edges: 900
Processed Edges: 1800
Processed N. Edges: 0
Explored Configs: 901
Query: AFinteger-constant(2) le tokens-count(p22)
parallel: This job succeeded:
/home/mcc/BenchKit/start.sh 7250000 /home/mcc/BenchKit/bin/verifypn-linux64 -s\ DFS\ -d\ 10 ./model.pnml ./CTLCardinality.xml -x 13
FORMULA HouseConstruction-PT-050-CTLCardinality-12 FALSE TECHNIQUES COLLATERAL_PROCESSING EXPLICIT STRUCTURAL_REDUCTION STATE_COMPRESSION STUBBORN_SETS
------------------- QUERY 14 ----------------------
No solution found
Parameters: -s DFS -d 10 ./model.pnml ./CTLCardinality.xml -x 14
Parameters: -s DFS -q 0 -d 10 ./model.pnml ./CTLCardinality.xml -x 14
------------------- QUERY 15 ----------------------
No solution found
Parameters: -s DFS -d 10 ./model.pnml ./CTLCardinality.xml -x 15
Parameters: -s DFS -q 0 -d 10 ./model.pnml ./CTLCardinality.xml -x 15
------------------- QUERY 16 ----------------------
Solution found
Parameters: -s DFS -d 10 ./model.pnml ./CTLCardinality.xml -x 16
Parameters: -s DFS -q 0 -d 10 ./model.pnml ./CTLCardinality.xml -x 16
Search=DFS,Trace=DISABLED,State_Space_Exploration=DISABLED,Structural_Reduction=AGGRESSIVE,Struct_Red_Timout=10,Stubborn_Reduction=ENABLED,Query_Simplication=ENABLED,QSTimeout=30,Siphon_Trap=DISABLED,LPSolve_Timeout=10
Query before reduction: EF A ((3 <= p5) U (3 <= p16))
Query after reduction: EF A ((3 <= p5) U (3 <= p16))
Query size reduced from 8 to 8 nodes (0.00 percent reduction).
Query reduction finished after 0.000732 seconds.
Query is satisfied.
STATS:
Time (seconds): 0.01856
Configurations: 8991
Markings: 5160
Edges: 16898
Processed Edges: 23229
Processed N. Edges: 0
Explored Configs: 7662
Query: EFA(integer-constant(3) le tokens-count(p5)) U (integer-constant(3) le tokens-count(p16))
Search=DFS,Trace=DISABLED,State_Space_Exploration=DISABLED,Structural_Reduction=AGGRESSIVE,Struct_Red_Timout=10,Stubborn_Reduction=ENABLED,Query_Simplication=DISABLED,Siphon_Trap=DISABLED,LPSolve_Timeout=10
Query is satisfied.
STATS:
Time (seconds): 0.01853
Configurations: 8991
Markings: 5160
Edges: 16898
Processed Edges: 23229
Processed N. Edges: 0
Explored Configs: 7662
Query: EFA(integer-constant(3) le tokens-count(p5)) U (integer-constant(3) le tokens-count(p16))
parallel: This job succeeded:
/home/mcc/BenchKit/start.sh 7250000 /home/mcc/BenchKit/bin/verifypn-linux64 -s\ DFS\ -d\ 10 ./model.pnml ./CTLCardinality.xml -x 16
FORMULA HouseConstruction-PT-050-CTLCardinality-15 TRUE TECHNIQUES COLLATERAL_PROCESSING EXPLICIT STRUCTURAL_REDUCTION STATE_COMPRESSION STUBBORN_SETS
---------------------------------------------------
Step 2: Sequential processing
---------------------------------------------------
Remaining queries are verified sequentially.
Each query is verified for a dynamic timeout (at least 400 seconds)
------------------- QUERY 2 ----------------------
Running query 2 for 450 seconds. Remaining: 7 queries and 3156 seconds
Parameters: -s DFS -d 100 -q 100 ./model.pnml ./CTLCardinality.xml -x 2
No solution found
------------------- QUERY 3 ----------------------
Running query 3 for 480 seconds. Remaining: 6 queries and 2880 seconds
Parameters: -s DFS -d 100 -q 100 ./model.pnml ./CTLCardinality.xml -x 3
No solution found
------------------- QUERY 5 ----------------------
Running query 5 for 519 seconds. Remaining: 5 queries and 2595 seconds
Parameters: -s DFS -d 100 -q 100 ./model.pnml ./CTLCardinality.xml -x 5
No solution found
------------------- QUERY 8 ----------------------
Running query 8 for 600 seconds. Remaining: 4 queries and 2402 seconds
Parameters: -s DFS -d 100 -q 100 ./model.pnml ./CTLCardinality.xml -x 8
No solution found
------------------- QUERY 12 ----------------------
Running query 12 for 706 seconds. Remaining: 3 queries and 2119 seconds
Parameters: -s DFS -d 100 -q 100 ./model.pnml ./CTLCardinality.xml -x 12
No solution found
------------------- QUERY 14 ----------------------
Running query 14 for 926 seconds. Remaining: 2 queries and 1852 seconds
Parameters: -s DFS -d 100 -q 100 ./model.pnml ./CTLCardinality.xml -x 14
No solution found
------------------- QUERY 15 ----------------------
Running query 15 for 1703 seconds. Remaining: 1 queries and 1703 seconds
Parameters: -s DFS -d 100 -q 100 ./model.pnml ./CTLCardinality.xml -x 15
No solution found
---------------------------------------------------
Step 3: Multiquery processing
---------------------------------------------------
Remaining 7 queries are solved using multiquery
Time remaining: 1508 seconds of the initial 3600 seconds
Running multiquery on -x 2,3,5,8,12,14,15 for 1508 seconds
Parameters: -s DFS -d 100 -q 100 -p ./model.pnml ./CTLCardinality.xml -x 2,3,5,8,12,14,15
End of script.
BK_STOP 1494814538924
--------------------
content from stderr:
Command terminated by signal 11
Command being timed: "timeout 450 /home/mcc/BenchKit/bin/verifypn-linux64 -s DFS -d 100 -q 100 ./model.pnml ./CTLCardinality.xml -x 2"
User time (seconds): 268.72
System time (seconds): 6.42
Percent of CPU this job got: 99%
Elapsed (wall clock) time (h:mm:ss or m:ss): 4:35.15
Average shared text size (kbytes): 0
Average unshared data size (kbytes): 0
Average stack size (kbytes): 0
Average total size (kbytes): 0
Maximum resident set size (kbytes): 14499440
Average resident set size (kbytes): 0
Major (requiring I/O) page faults: 0
Minor (reclaiming a frame) page faults: 3624520
Voluntary context switches: 3
Involuntary context switches: 507
Swaps: 0
File system inputs: 0
File system outputs: 0
Socket messages sent: 0
Socket messages received: 0
Signals delivered: 0
Page size (bytes): 4096
Exit status: 0
Command terminated by signal 11
Command being timed: "timeout 480 /home/mcc/BenchKit/bin/verifypn-linux64 -s DFS -d 100 -q 100 ./model.pnml ./CTLCardinality.xml -x 3"
User time (seconds): 279.38
System time (seconds): 6.32
Percent of CPU this job got: 99%
Elapsed (wall clock) time (h:mm:ss or m:ss): 4:45.73
Average shared text size (kbytes): 0
Average unshared data size (kbytes): 0
Average stack size (kbytes): 0
Average total size (kbytes): 0
Maximum resident set size (kbytes): 14499512
Average resident set size (kbytes): 0
Major (requiring I/O) page faults: 0
Minor (reclaiming a frame) page faults: 3624437
Voluntary context switches: 3
Involuntary context switches: 530
Swaps: 0
File system inputs: 0
File system outputs: 0
Socket messages sent: 0
Socket messages received: 0
Signals delivered: 0
Page size (bytes): 4096
Exit status: 0
Command terminated by signal 11
Command being timed: "timeout 519 /home/mcc/BenchKit/bin/verifypn-linux64 -s DFS -d 100 -q 100 ./model.pnml ./CTLCardinality.xml -x 5"
User time (seconds): 185.84
System time (seconds): 6.50
Percent of CPU this job got: 99%
Elapsed (wall clock) time (h:mm:ss or m:ss): 3:12.36
Average shared text size (kbytes): 0
Average unshared data size (kbytes): 0
Average stack size (kbytes): 0
Average total size (kbytes): 0
Maximum resident set size (kbytes): 14493272
Average resident set size (kbytes): 0
Major (requiring I/O) page faults: 0
Minor (reclaiming a frame) page faults: 3626957
Voluntary context switches: 3
Involuntary context switches: 352
Swaps: 0
File system inputs: 0
File system outputs: 0
Socket messages sent: 0
Socket messages received: 0
Signals delivered: 0
Page size (bytes): 4096
Exit status: 0
Command terminated by signal 11
Command being timed: "timeout 600 /home/mcc/BenchKit/bin/verifypn-linux64 -s DFS -d 100 -q 100 ./model.pnml ./CTLCardinality.xml -x 8"
User time (seconds): 276.44
System time (seconds): 6.26
Percent of CPU this job got: 99%
Elapsed (wall clock) time (h:mm:ss or m:ss): 4:42.90
Average shared text size (kbytes): 0
Average unshared data size (kbytes): 0
Average stack size (kbytes): 0
Average total size (kbytes): 0
Maximum resident set size (kbytes): 14499428
Average resident set size (kbytes): 0
Major (requiring I/O) page faults: 0
Minor (reclaiming a frame) page faults: 3624532
Voluntary context switches: 3
Involuntary context switches: 641
Swaps: 0
File system inputs: 0
File system outputs: 0
Socket messages sent: 0
Socket messages received: 0
Signals delivered: 0
Page size (bytes): 4096
Exit status: 0
Command terminated by signal 11
Command being timed: "timeout 706 /home/mcc/BenchKit/bin/verifypn-linux64 -s DFS -d 100 -q 100 ./model.pnml ./CTLCardinality.xml -x 12"
User time (seconds): 261.52
System time (seconds): 5.70
Percent of CPU this job got: 99%
Elapsed (wall clock) time (h:mm:ss or m:ss): 4:27.24
Average shared text size (kbytes): 0
Average unshared data size (kbytes): 0
Average stack size (kbytes): 0
Average total size (kbytes): 0
Maximum resident set size (kbytes): 14499500
Average resident set size (kbytes): 0
Major (requiring I/O) page faults: 0
Minor (reclaiming a frame) page faults: 3624471
Voluntary context switches: 3
Involuntary context switches: 506
Swaps: 0
File system inputs: 0
File system outputs: 0
Socket messages sent: 0
Socket messages received: 0
Signals delivered: 0
Page size (bytes): 4096
Exit status: 0
Command terminated by signal 11
Command being timed: "timeout 926 /home/mcc/BenchKit/bin/verifypn-linux64 -s DFS -d 100 -q 100 ./model.pnml ./CTLCardinality.xml -x 14"
User time (seconds): 143.98
System time (seconds): 5.52
Percent of CPU this job got: 99%
Elapsed (wall clock) time (h:mm:ss or m:ss): 2:29.60
Average shared text size (kbytes): 0
Average unshared data size (kbytes): 0
Average stack size (kbytes): 0
Average total size (kbytes): 0
Maximum resident set size (kbytes): 14499440
Average resident set size (kbytes): 0
Major (requiring I/O) page faults: 0
Minor (reclaiming a frame) page faults: 3624520
Voluntary context switches: 3
Involuntary context switches: 341
Swaps: 0
File system inputs: 0
File system outputs: 0
Socket messages sent: 0
Socket messages received: 0
Signals delivered: 0
Page size (bytes): 4096
Exit status: 0
Command terminated by signal 11
Command being timed: "timeout 1703 /home/mcc/BenchKit/bin/verifypn-linux64 -s DFS -d 100 -q 100 ./model.pnml ./CTLCardinality.xml -x 15"
User time (seconds): 189.07
System time (seconds): 5.67
Percent of CPU this job got: 99%
Elapsed (wall clock) time (h:mm:ss or m:ss): 3:14.88
Average shared text size (kbytes): 0
Average unshared data size (kbytes): 0
Average stack size (kbytes): 0
Average total size (kbytes): 0
Maximum resident set size (kbytes): 14499452
Average resident set size (kbytes): 0
Major (requiring I/O) page faults: 0
Minor (reclaiming a frame) page faults: 3624454
Voluntary context switches: 3
Involuntary context switches: 438
Swaps: 0
File system inputs: 0
File system outputs: 0
Socket messages sent: 0
Socket messages received: 0
Signals delivered: 0
Page size (bytes): 4096
Exit status: 0
Command terminated by signal 11
Command being timed: "timeout 1508 /home/mcc/BenchKit/bin/verifypn-linux64 -s DFS -d 100 -q 100 -p ./model.pnml ./CTLCardinality.xml -x 2,3,5,8,12,14,15"
User time (seconds): 260.74
System time (seconds): 6.18
Percent of CPU this job got: 99%
Elapsed (wall clock) time (h:mm:ss or m:ss): 4:27.05
Average shared text size (kbytes): 0
Average unshared data size (kbytes): 0
Average stack size (kbytes): 0
Average total size (kbytes): 0
Maximum resident set size (kbytes): 14499516
Average resident set size (kbytes): 0
Major (requiring I/O) page faults: 0
Minor (reclaiming a frame) page faults: 3624765
Voluntary context switches: 3
Involuntary context switches: 650
Swaps: 0
File system inputs: 0
File system outputs: 0
Socket messages sent: 0
Socket messages received: 0
Signals delivered: 0
Page size (bytes): 4096
Exit status: 0
Sequence of Actions to be Executed by the VM
This is useful if one wants to reexecute the tool in the VM from the submitted image disk.
set -x
# this is for BenchKit: configuration of major elements for the test
export BK_INPUT="HouseConstruction-PT-050"
export BK_EXAMINATION="CTLCardinality"
export BK_TOOL="tapaal"
export BK_RESULT_DIR="/tmp/BK_RESULTS/OUTPUTS"
export BK_TIME_CONFINEMENT="3600"
export BK_MEMORY_CONFINEMENT="16384"
# this is specific to your benchmark or test
export BIN_DIR="$HOME/BenchKit/bin"
# remove the execution directoty if it exists (to avoid increse of .vmdk images)
if [ -d execution ] ; then
rm -rf execution
fi
tar xzf /home/mcc/BenchKit/INPUTS/HouseConstruction-PT-050.tgz
mv HouseConstruction-PT-050 execution
# this is for BenchKit: explicit launching of the test
cd execution
echo "====================================================================="
echo " Generated by BenchKit 2-3254"
echo " Executing tool tapaal"
echo " Input is HouseConstruction-PT-050, examination is CTLCardinality"
echo " Time confinement is $BK_TIME_CONFINEMENT seconds"
echo " Memory confinement is 16384 MBytes"
echo " Number of cores is 4"
echo " Run identifier is r029-blw3-149440265900606"
echo "====================================================================="
echo
echo "--------------------"
echo "content from stdout:"
echo
echo "=== Data for post analysis generated by BenchKit (invocation template)"
echo
if [ "CTLCardinality" = "UpperBounds" ] ; then
echo "The expected result is a vector of positive values"
echo NUM_VECTOR
elif [ "CTLCardinality" != "StateSpace" ] ; then
echo "The expected result is a vector of booleans"
echo BOOL_VECTOR
else
echo "no data necessary for post analysis"
fi
echo
if [ -f "CTLCardinality.txt" ] ; then
echo "here is the order used to build the result vector(from text file)"
for x in $(grep Property CTLCardinality.txt | cut -d ' ' -f 2 | sort -u) ; do
echo "FORMULA_NAME $x"
done
elif [ -f "CTLCardinality.xml" ] ; then # for cunf (txt files deleted;-)
echo echo "here is the order used to build the result vector(from xml file)"
for x in $(grep '
echo "FORMULA_NAME $x"
done
fi
echo
echo "=== Now, execution of the tool begins"
echo
echo -n "BK_START "
date -u +%s%3N
echo
timeout -s 9 $BK_TIME_CONFINEMENT bash -c "/home/mcc/BenchKit/BenchKit_head.sh 2> STDERR ; echo ; echo -n \"BK_STOP \" ; date -u +%s%3N"
if [ $? -eq 137 ] ; then
echo
echo "BK_TIME_CONFINEMENT_REACHED"
fi
echo
echo "--------------------"
echo "content from stderr:"
echo
cat STDERR ;