

1. Introduction
This page summarizes the results for the 2016 edition of the Model Checking Contest (MCC’2016). This page is divided in three sections:
- First, we list the qualified tools for the MCC'2016,
- Then, we provide some informations about the experimental conditions of the MCC'2016,
- Then, we present an access to details about results,
- Then, we provide the list of winners of the MCC'2016,
- Finally, we provide an attempt to evaluate tool reliability based on the comparison of the results provided in the contest.
IMPORTANT:all these documents can be reused in scientific material and papers but must respect the Creative Common licence CC-BY-NC-SA.
2. List of Qualified Tools in 2016
Ten tools where submitted this year. They all successfully went through a qualification process requiring a total number of more than 25000 runs (each tool had to answer each examination for the first instance of each «known» model).
Data about these tools are summarized in the table below. For any tool, you can download the disk image that was provided with all its data. You may use these to reproduce measures locally and perform comparison with your own tool on the same benchmark.
| Summary of the Participating Tools (alphabetical order) | |||||
| Tool name | Representative Author | Origin | Type of execution | Link to the submitted disk image | Reported Techniques (all examinations) |
|---|---|---|---|---|---|
| ITS-Tools | Y. Thierry-Mieg | Univ. P. & M. Curie (France) | Parallel (collateral processing) |  |
DECISION_DIAGRAMS SAT_SMT INITIAL_STATE TOPOLOGICAL USE_NUPN |
| LoLA | K. Wolf | Univ. Rostock (Germany) | Sequential | |
EXPLICIT SAT_SMT STATE_COMPRESSION STUBBORN_SETS TOPOLOGICAL |
| LTSMin | J. Meijer and J. van de Pol | Univ. Twente (Netherlands) | Parallel (parallel processing) | |
DECISION_DIAGRAMS EXPLICIT STATIC_VARIABLE_REORDERING USE_NUPN |
| Marcie | C. Rohr and M. Heiner | Univ. Cottbus (Germany) | Sequential | |
DECISION_DIAGRAMS UNFOLDING_TO_PT |
| PeCan | G. Trịnh | Ho Chi Minh Univ. of technology (Vietnâm) | Sequential | |
EXPLICIT |
| pnmc | A. Hamez | Steery.io (France) | Sequential | |
DECISION_DIAGRAMS USE_NUPN |
| PNXDD | E. Paviot-Adet | Univ. P. & M. Curie (France) | Sequential | |
DECISION_DIAGRAMS TOPOLOGICAL |
| smart | G. Ciardo and A. Miner | Iowa State University (USA) | Sequential | |
DECISION_DIAGRAMS |
| TAPAAL | J. Srba | Univ. Aalborg (Denmark) | 3 variants (2 sequential, 1 with parallel processing) | or |
COMPRESSION EXPLICIT STATE_COMPRESSION STATE_EQUATIONS STRUCTURAL_REDUCTION (all versions) |
| ydd-pt | D. Racordon | Univ. Geneva (Switzerland) | Sequential | |
DECISION_DIAGRAMS |
The table below lists the techniques reported per examination (and for all the tool variants when applicable).
| Techniques Reported by the Participating Tools (per examination) | |||||
| Tool name | StateSpace | UpperBounds | Reachability | CTL | LTL |
|---|---|---|---|---|---|
| ITS-Tools | DECISION_DIAGRAMS TOPOLOGICAL USE_NUPN | DECISION_DIAGRAMS TOPOLOGICAL | COLLATERAL_PROCESSING DECISION_DIAGRAMS INITIAL_STATE TOPOLOGICAL USE_NUPN | DECISION_DIAGRAMS TOPOLOGICAL USE_NUPN | DECISION_DIAGRAMS TOPOLOGICAL USE_NUPN |
| LoLA | - | EXPLICIT SAT_SMT STATE_COMPRESSION STUBBORN_SETS TOPOLOGICAL | EXPLICIT SAT_SMT STATE_COMPRESSION STUBBORN_SETS TOPOLOGICAL | EXPLICIT SAT_SMT STATE_COMPRESSION STUBBORN_SETS TOPOLOGICAL | EXPLICIT SAT_SMT STATE_COMPRESSION STUBBORN_SETS TOPOLOGICAL |
| LTSMin | DECISION_DIAGRAMS USE_NUPN STATIC_VARIABLE_REORDERING | - | DECISION_DIAGRAMS USE_NUPN STATIC_VARIABLE_REORDERING | DECISION_DIAGRAMS USE_NUPN STATIC_VARIABLE_REORDERING | EXPLICIT USE_NUPN STATIC_VARIABLE_REORDERING |
| Marcie | DECISION_DIAGRAMS UNFOLDING_TO_PT | DECISION_DIAGRAMS UNFOLDING_TO_PT | DECISION_DIAGRAMS UNFOLDING_TO_PT | DECISION_DIAGRAMS UNFOLDING_TO_PT | - |
| PeCan | EXPLICIT | EXPLICIT | |||
| pnmc | DECISION_DIAGRAMS USE_NUPN | - | - | - | - |
| PNXDD | DECISION_DIAGRAMS TOPOLOGICAL | - | - | - | - |
| smart | DECISION_DIAGRAMS | - | - | - | - |
| TAPAAL (exp) | EXPLICIT STRUCTURAL_REDUCTION STATE_COMPRESSION | EXPLICIT STRUCTURAL_REDUCTION STATE_COMPRESSION | EXPLICIT STRUCTURAL_REDUCTION STATE_COMPRESSION | - | - |
| TAPAAL (par) | EXPLICIT | EXPLICIT STRUCTURAL_REDUCTION | EXPLICIT STRUCTURAL_REDUCTION | EXPLICIT COMPRESSION | - |
| TAPAAL (seq) | EXPLICIT | EXPLICIT STRUCTURAL_REDUCTION | EXPLICIT STRUCTURAL_REDUCTION | EXPLICIT | - |
| ydd-pt | DECISION_DIAGRAMS | - | - | - | - |
3. Experimental Conditions of the MCC'2016
Each tool was submitted to 10701 executions in various conditions (1189 model/instances and 9 examinations per model/instance) for which it could report: DNC (do not compete), CC (cannot compute) or the result of the query. These executions were handled by BenchKit, that was developed in the context of the MCC for massive testing of software. Then, from the raw data provided by BenchKit, some post-analysis scripts consolidated these and computed a ranking.
16 GB of memory were allocated to each virtual machine (both parallel and sequential tools) and a confinement of one hour was considered (execution aborted after one hour). So, a total of 128 682 runs (execution of one examination by the virtual machine) generated 24 Gbyte of raw data (essentially log files and CSV of sampled data)
The table below shows some data about the involved machines and their contribution to the computation of these results.
| Involved Machines and Execution of the Benchmarks | |||||
| bluewhale03 | Ebro | Quadhexa-2 | Small | Total | |
|---|---|---|---|---|---|
| Cores | 40 @ 2.8GHz | 64 @ 2.7GHz | 24 @ 2.66GHz | 11×24 @ 2.4GHz | - |
| Memory (GB) | 512 | 1024 | 128 | 11×64 | - |
| Used Cores sequential tools) | 31, 31 VM in // |
63, 63 VM in // |
7, 7 VM in // |
5×3, 5×3 VM in // |
- |
| Used Cores (parallel tools) | 36 (4 per VM), 9 VM in // |
60 (4 per VM), 15 VM in // |
20 (4 per VM), 5 VM in // |
1×12 (4 per VM), 11×3 VM in // |
- |
| Number of runs | 13 374 | 36 936 | 15 768 | 62 604 | 128 682 |
| Total CPU required | 156d, 17h, 44m, 59s | 485d, 19h, 27m, 43s | 203d, 0h, 25m, 47s | 636d, 9h, 11m, 36s | 1481d, 22h, 50m, 5s |
| Total CPU | about 4 years and 20 days | - | |||
| Time spent to complete benchmarks | about 22 days and 1 hours | - | |||
| Estimated boot time of VMs + management (overhead) |
22 d, 8h (Included in total CPU) | - | |||
We are please to thanks those who helped in the execution of tools:
- Bluewhale03 was made available by colleagues at Université de Genève,
- Ebro was made available by colleagues at Rostock University,
- Quadhexa-2 was made available by colleagues at Université Paris Ouest Nanterre La Défense,
- Small is one of the two clusters at LI6 (we got 11 nodes our of 23 there) Université Pierre & Marie Curie.
4. The Results of the MCC’2016
This First table below presents detailed results about the MCC'2016.
| Details about the Examinations in the MCC'2016 (part I): Details about Results and Scoring + Model Performance Charts |
|||
| Details about Results and Scoring |
Model Performance Charts |
Tool Resource consumption |
|
|---|---|---|---|
| StateSpace | |||
| UpperBounds | |||
| ReachabilityCardinality | |||
| ReachabilityDeadlock | |||
| ReachabilityFireability | |||
| CTLCardinality | |||
| CTLFireability | |||
| LTLCardinality | |||
| LTLFireability | |||
This Second table below presents some performance analysis related to tools during the MCC'2016.
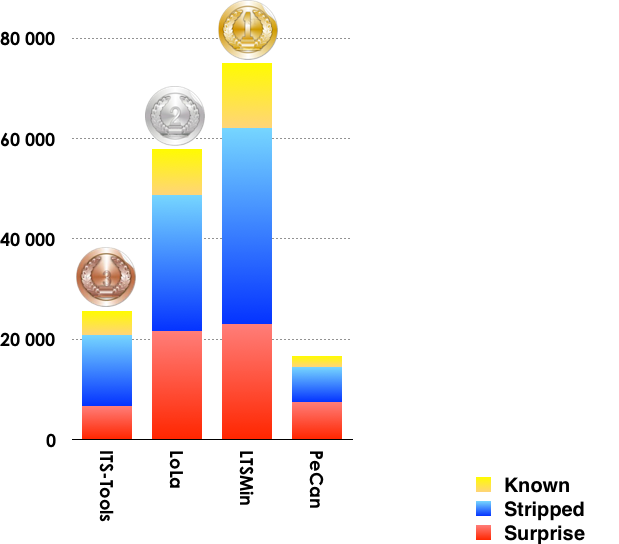
| Details about the examinations in the MCC'2016 (part II)Tool Performance Charts | ||||
| All models |
«Surprise» models only |
«Stripped» models only |
«Known» models only |
|
|---|---|---|---|---|
| ITS-Tools | ||||
| LoLA | ||||
| LTSMin | ||||
| Marcie | ||||
| PeCan | ||||
| pnmc | ||||
| PNXDD | ||||
| smart | ||||
| Tapaal (exp) | ||||
| Tapaal (par) | ||||
| Tapaal (seq) | ||||
| Ydd-pt | ||||
You can download the full archive (3.6 GB compressed and 32 GB uncompressed) of the 128 682 runs processed to compute the results of the MCC'2016. This archive contains execution traces, execution logs and sampling, as well as a large CSV files that summarizes all the executions and gnuplot scripts and data to generate the charts produced in the web site. Yo may get separately the two mostly interesting CSV files:
- GlobalSummary.csv that summarizes all results from all runs in the contest (20 MB when expanded),
- raw-result-analysis.csv that contains the same data as the previous one but enriched with scoring information and the expected results (computed as a majority of tools pondered by their confidence rate, 27 MB when expanded).
Note that from the two CSV file, you can identify the unique run identifier that allors you to find the traces and any information in the archive (theyr are also available on the web site when the too did participated).
5. The Winners for the MCC'2016
This section presents the results for the main examinations that are:
- State Space generation,
- UpperBounds computation,
- Reachability Formulas (ReachabilityCardinality, ReachabilityDeadlock, ReachabilityFireability),
- CTL Formulas (CTLCardinality, CTLFireability),
- LTL Formulas (LTLCardinality, LTLFireability),
Each examination for a given model brought 16 points (see the details in the slides). A multiplier was applied depending to the model category:
- ×1 for «Known» models,
- ×3 for «Stripped» models,
- ×5 for «Surprise» models.
We manually detected a few values (3 or 4) for which apparently the majority of tools where wrong. However, this has only a minor impact on the scoring and could not change the order of tools for any category. A way to deal with such (rare) situations will be considered for the next edition.
Presented scores are dispatched over the three categories of models (yellow for «Known» models, blue for «Stripped» models and red for «Surprise» models). The maximum number of points that a tool could get for a given examination was:
- 8 400 for «Known» models (+ a maximum of 4 200 bonus points),
- 25 200 for «Stripped» models (+ a maximum of 12 600 bonus points),
- 11 120 for «Surprise» models (+ a maximum of 5 560 bonus points).
Note that bonuses are not always collected.
5.1. Winners in the StateSpace Category
This examination had the highest participation rate (10 tools out of 12). Results based on the scoring shown below is:
- ITS-Tools was ranked first,
- Marciewas ranked second,
- pnmcwas ranked third.
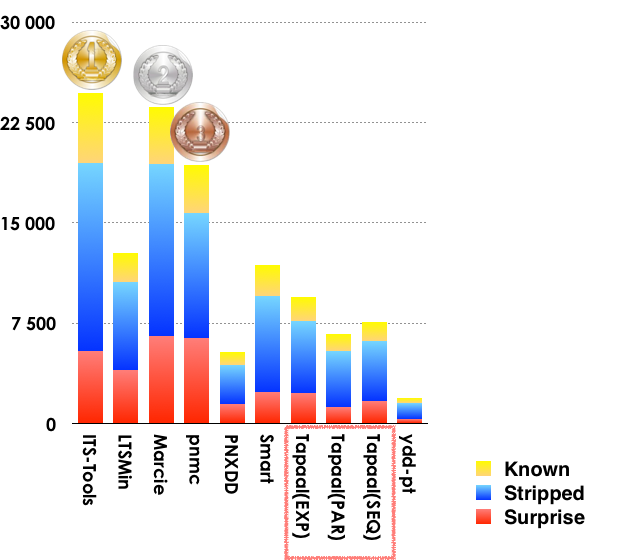
Note that all the variants of TAPAAL were considered as one tool with regards to the scoring (see rule E-4.5.).
5.2. Winners in the UpperBounds Category
6 (+1, see below) tools out of 12 participated in this examination. Results based on the scoring shown below is:
- Marcie was ranked first,
- LoLAwas ranked second,
- ITS-Toolswas ranked third.
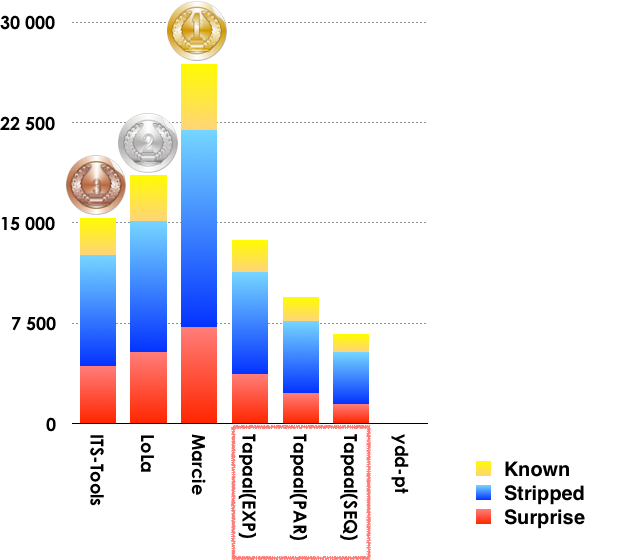
Note that all the variants of TAPAAL were considered as one tool with regards to the scoring (see rule E-4.5.) . Ydd-pt seems to participate and get no score but these are two accidently "Cannot Compute" answers instead of "Do not compete" that fooled analysis scripts to state that Ydd-pt was participating
5.3. Winners in the Reachability Formulas Category
8 tools out of 12 participated in these examinations (ReachabilityDeadlock, ReachabilityCardinality and ReachabilityFireability). Results based on the scoring shown below is:
- LoLA was ranked first,
- TAPAALwas ranked second (the classic sequential version),
- ITS-Toolswas ranked third.
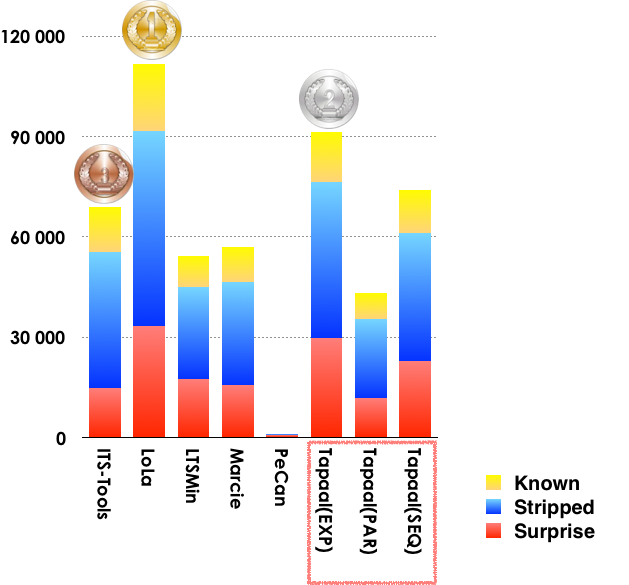
Note that all the variants of TAPAAL were considered as one tool with regards to the scoring (see rule E-4.5.). We also noted an interaction problem with PeCan. After discussing with the tool developers, it seems that the tool may answers some values in cases it should answer "Cannot compute", thus leading to this bad situation for which the internal engine seems innocent.
5.4. Winners in the CTL Formulas Category
5 tools out of 12 participated in these examinations (CTLCardinality and CTLFireability). Results based on the scoring shown below is:
- LoLA was ranked first,
- Tapaalwas ranked second (the sequential version),
- Marciewas ranked third.
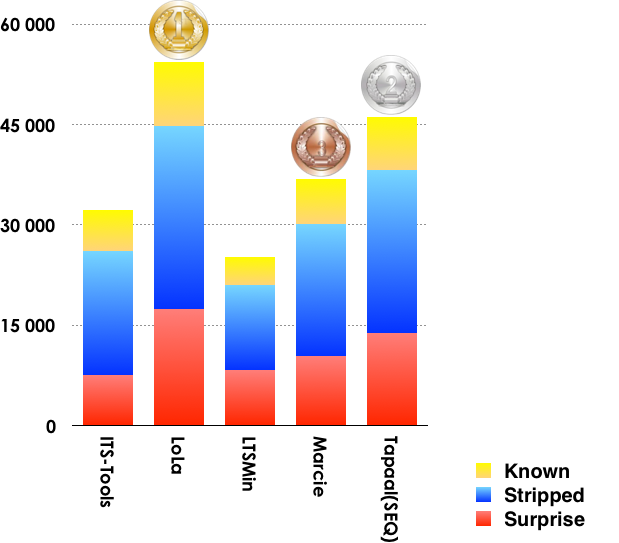
We discovered that the parallel implementation of Tapaal used a compiler option that caused the tool to crash when run on machines different from the one used in the qualification round. This was mainly an issue for the CTL examinations and for Tapaal(PAR) that was withdrawn from the CTL examination competition.
5.5. Winners in the LTL Formulas Category
4 tools out of 12 participated in these examinations (LTLCardinality and LTLFireability). Results based on the scoring shown below is:
- LTSMin was ranked first,
- LoLAwas ranked second (the classic sequential version),
- ITS-Toolswas ranked third.
6. Estimation of Tool Confidence
As for last year, we tried to introduce some confidence analysis to enforce the computation of «right results» based on the answers of participating tools. To do so, we considered each value provided in the contest (a value is a partial result such as the result of a formula or a number provided for state space, bound computation, etc.). To do so, we processed as follows:
- For each «line» (all tools for a given examination for a given instance), we selected all «significant values» where at least 3 tools do agree.
- Based on this subset of values, we computed the ratio between the selected values for the tool and the number of good answers. This ratio gave us a tool confidence rate (called reliability rate last year) that is provided in the table below.
- This tool confidence rate rate was then applied to compute the scores presented in the dedicated section.
The table below provides, in first column, the computed confidence rates (that are naturally lower for tools where a bug was detected). Then, the table provides the number of correct results (column 2) out of the number of «significant values» selected for the tool (column 3). The last column shows the number of examination (and their type) the tool was involved in.
| Estimated Tool Confidence rate (based on the «significant values» computed by tools) | ||||
| Tool name | Reliability | Correct Values | «significant values» | Involved Examinations |
|---|---|---|---|---|
| ITS-Tools | 98,38 % | 33 634 | 34 189 | 9 (StateSpace, UpperBounds, Reachability, CTL, LTL) |
| LoLA | 99,22 % | 41 011 | 41 335 | 8 (UpperBounds, Reachability, CTL, LTL) |
| LTSMin | 99,98 % | 34 902 | 34 910 | 8 (StateSpace, Reachability, CTL, LTL) |
| Marcie | 99,99 % | 27 361 | 27 364 | 7 (StateSpace, UpperBounds, Reachability, CTL) |
| PeCan | 37,54 % | 3 967 | 10 568 | 5 (Reachability, LTL) |
| pnmc | 99,84 % | 1 219 | 1 221 | 1 (StateSpace) |
| PNXDD | 99,11 % | 222 | 224 | 1 (StateSpace) |
| Smart | 98,72 % | 926 | 938 | 1 (StateSpace) |
| TAPAAL (EXP) | 99,95 % | 22 421 | 22 434 | 5 (StateSpace, UpperBounds, Reachability) |
| TAPAAL (PAR) | 99,98 % | 19 555 | 19 558 | 7 (StateSpace, UpperBounds, Reachability, CTL) |
| TAPAAL (SEQ) | 99,97 % | 30 130 | 30 140 | 7 (StateSpace, UpperBounds, Reachability, CTL) |
| ydd-pt | 97,70 % | 85 | 87 | 2 (StateSpace, UpperBounds) |
This table raises some comments about PeCan for which the confidence rate is very low. After discussing with the tool developers, it seems that the tool may answers some values in cases it should answer "Cannot compute", thus leading to this bad situation for which the internal engine seems innocent.