About the Execution of LTSMin for S_ResAllocation-PT-R003C010
| Execution Summary | |||||
| Max Memory Used (MB) |
Time wait (ms) | CPU Usage (ms) | I/O Wait (ms) | Computed Result | Execution Status |
| 214.550 | 1243.00 | 1786.00 | 27.90 | 823552 ? 1 ? | normal |
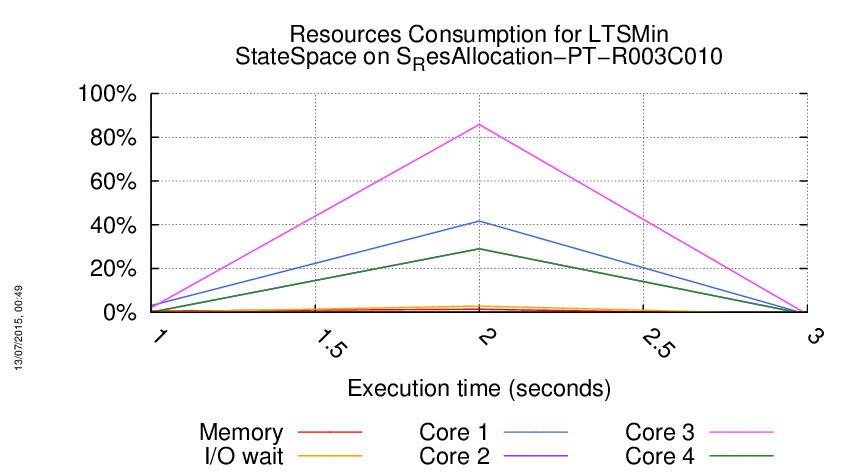
Execution Chart
We display below the execution chart for this examination (boot time has been removed).

Trace from the execution
Waiting for the VM to be ready (probing ssh)
................
=====================================================================
Generated by BenchKit 2-2265
Executing tool ltsmin
Input is S_ResAllocation-PT-R003C010, examination is StateSpace
Time confinement is 3600 seconds
Memory confinement is 16384 MBytes
Number of cores is 4
Run identifier is r217st-ebro-143344927801054
=====================================================================
--------------------
content from stdout:
=== Data for post analysis generated by BenchKit (invocation template)
no data necessary for post analysis
=== Now, execution of the tool begins
BK_START 1433715175689
STATE_SPACE STATES 823552 TECHNIQUES DECISION_DIAGRAMS PARALLEL_PROCESSING USE_NUPN STATIC_VARIABLE_REORDERING
STATE_SPACE TRANSITIONS -1 TECHNIQUES DECISION_DIAGRAMS PARALLEL_PROCESSING USE_NUPN STATIC_VARIABLE_REORDERING
STATE_SPACE MAX_TOKEN_PER_MARKING -1 TECHNIQUES DECISION_DIAGRAMS PARALLEL_PROCESSING USE_NUPN STATIC_VARIABLE_REORDERING
STATE_SPACE MAX_TOKEN_IN_PLACE 1 TECHNIQUES DECISION_DIAGRAMS PARALLEL_PROCESSING USE_NUPN STATIC_VARIABLE_REORDERING
BK_STOP 1433715176932
--------------------
content from stderr:
Initializing Lace, 0 nodes, 4 cores, 4 logical processors, 4 workers.
pins2lts-sym: Using 4 CPUs
pins2lts-sym: Exploration order is chain
pins2lts-sym: Saturation strategy is sat-like
pins2lts-sym: Guided search strategy is unguided
pins2lts-sym: Attractor strategy is default
pins2lts-sym: Registering PINS so language module
pins2lts-sym: Main process: 0.
Lace startup, creating 4 worker threads with program stack 8388608 bytes.
pins2lts-sym: opening model.so
pins2lts-sym: library has no initializer
pins2lts-sym: loading model PNML
pins2lts-sym: completed loading model PNML
pins2lts-sym: Regroup specification: cn,w2W,ru,lb:cs.rs.cw:cs.rs.cs,rs,vf
pins2lts-sym: Regroup Column Nub
pins2lts-sym: Regroup over-approximate must-write to may-write
pins2lts-sym: Regroup Row sUbsume
pins2lts-sym: Regroup Lowest Bandwidth
pins2lts-sym: Computing lowest bandwidth in: ":cs.rs.cw:cs.rs.cs"
pins2lts-sym: Bandwidth of may-write matrix with sequence "ε": 53
pins2lts-sym: Regroup Column Sort
pins2lts-sym: Regroup Row Sort
pins2lts-sym: Regroup Column sWaps
pins2lts-sym: Bandwidth of may-write matrix with sequence "cs.rs.cw": 36
pins2lts-sym: Regroup Column Sort
pins2lts-sym: Regroup Row Sort
pins2lts-sym: Regroup Column Sort
pins2lts-sym: Bandwidth of may-write matrix with sequence "cs.rs.cs": 91
pins2lts-sym: Regroup Row Sort
pins2lts-sym: Reqroup Vertical Flip
pins2lts-sym: Regrouping: 40->20 groups
pins2lts-sym: state vector length is 60; there are 20 groups and 60 guards
pins2lts-sym: Creating a multi-core ListDD domain.
pins2lts-sym: Using GBgetTransitionsShort as next-state function
pins2lts-sym: got initial state
pins2lts-sym: vrel_add_act not supported; falling back to vrel_add_cpy
pins2lts-sym: Exploration took 136 group checks and 136 next state calls
pins2lts-sym: reachability took 0.460 real 1.180 user 0.670 sys
pins2lts-sym: counting visited states...
pins2lts-sym: counting took 0.010 real 0.000 user 0.040 sys
pins2lts-sym: state space has 823552 states, 507 nodes
pnml: max token count: 1
Sequence of Actions to be Executed by the VM
This is useful if one wants to reexecute the tool in the VM from the submitted image disk.
set -x
# this is for BenchKit: configuration of major elements for the test
export BK_INPUT="S_ResAllocation-PT-R003C010"
export BK_EXAMINATION="StateSpace"
export BK_TOOL="ltsmin"
export BK_RESULT_DIR="/users/gast00/fkordon/BK_RESULTS/OUTPUTS"
export BK_TIME_CONFINEMENT="3600"
export BK_MEMORY_CONFINEMENT="16384"
# this is specific to your benchmark or test
export BIN_DIR="$HOME/BenchKit/bin"
# remove the execution directoty if it exists (to avoid increse of .vmdk images)
if [ -d execution ] ; then
rm -rf execution
fi
tar xzf /home/mcc/BenchKit/INPUTS/S_ResAllocation-PT-R003C010.tgz
mv S_ResAllocation-PT-R003C010 execution
# this is for BenchKit: explicit launching of the test
cd execution
echo "====================================================================="
echo " Generated by BenchKit 2-2265"
echo " Executing tool ltsmin"
echo " Input is S_ResAllocation-PT-R003C010, examination is StateSpace"
echo " Time confinement is $BK_TIME_CONFINEMENT seconds"
echo " Memory confinement is 16384 MBytes"
echo " Number of cores is 4"
echo " Run identifier is r217st-ebro-143344927801054"
echo "====================================================================="
echo
echo "--------------------"
echo "content from stdout:"
echo
echo "=== Data for post analysis generated by BenchKit (invocation template)"
echo
if [ "StateSpace" = "ReachabilityComputeBounds" ] ; then
echo "The expected result is a vector of positive values"
echo NUM_VECTOR
elif [ "StateSpace" != "StateSpace" ] ; then
echo "The expected result is a vector of booleans"
echo BOOL_VECTOR
else
echo "no data necessary for post analysis"
fi
echo
if [ -f "StateSpace.txt" ] ; then
echo "here is the order used to build the result vector(from text file)"
for x in $(grep Property StateSpace.txt | cut -d ' ' -f 2 | sort -u) ; do
echo "FORMULA_NAME $x"
done
elif [ -f "StateSpace.xml" ] ; then # for cunf (txt files deleted;-)
echo echo "here is the order used to build the result vector(from xml file)"
for x in $(grep '
echo "FORMULA_NAME $x"
done
fi
echo
echo "=== Now, execution of the tool begins"
echo
echo -n "BK_START "
date -u +%s%3N
echo
timeout -s 9 $BK_TIME_CONFINEMENT bash -c "/home/mcc/BenchKit/BenchKit_head.sh 2> STDERR ; echo ; echo -n \"BK_STOP \" ; date -u +%s%3N"
if [ $? -eq 137 ] ; then
echo
echo "BK_TIME_CONFINEMENT_REACHED"
fi
echo
echo "--------------------"
echo "content from stderr:"
echo
cat STDERR ;

