About the Execution of LTSMin for GlobalResAllocation-PT-05
| Execution Summary | |||||
| Max Memory Used (MB) |
Time wait (ms) | CPU Usage (ms) | I/O Wait (ms) | Computed Result | Execution Status |
| 1509.460 | 118066.00 | 119320.00 | 708.80 | ? | normal |
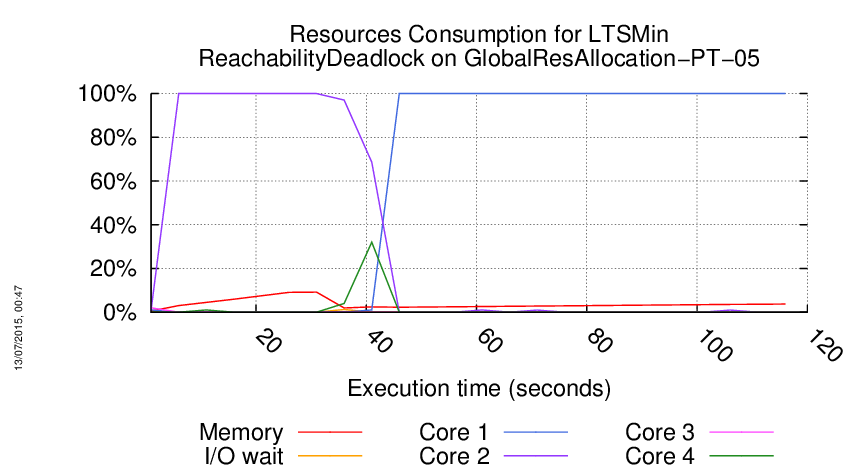
Execution Chart
We display below the execution chart for this examination (boot time has been removed).

Trace from the execution
Waiting for the VM to be ready (probing ssh)
..............
=====================================================================
Generated by BenchKit 2-2265
Executing tool ltsmin
Input is GlobalResAllocation-PT-05, examination is ReachabilityDeadlock
Time confinement is 3600 seconds
Memory confinement is 16384 MBytes
Number of cores is 4
Run identifier is r049kn-ebro-143236500800310
=====================================================================
--------------------
content from stdout:
=== Data for post analysis generated by BenchKit (invocation template)
The expected result is a vector of booleans
BOOL_VECTOR
here is the order used to build the result vector(from text file)
FORMULA_NAME GlobalResAllocation-COL-05-ReachabilityDeadlock-0
=== Now, execution of the tool begins
BK_START 1432504119866
FORMULA GlobalResAllocation-COL-05-ReachabilityDeadlock-0 CANNOT_COMPUTE
BK_STOP 1432504237932
--------------------
content from stderr:
property name is GlobalResAllocation-COL-05-ReachabilityDeadlock-0
Initializing Lace, 0 nodes, 4 cores, 4 logical processors, 4 workers.
pins2lts-sym: Using 4 CPUs
pins2lts-sym: Exploration order is chain
pins2lts-sym: Saturation strategy is sat-like
pins2lts-sym: Guided search strategy is unguided
pins2lts-sym: Attractor strategy is default
pins2lts-sym: Registering PINS so language module
pins2lts-sym: Main process: 0.
Lace startup, creating 4 worker threads with program stack 8388608 bytes.
pins2lts-sym: opening model.so
pins2lts-sym: library has no initializer
pins2lts-sym: loading model PNML
*** segmentation fault ***
Please send information on how to reproduce this problem to:
ltsmin-support@lists.utwente.nl
along with all output preceding this message.
In addition, include the following information:
Package: ltsmin 2.1
Stack trace:
0: pins2lts-sym(HREprintStack+0x1a) [0x43b51a]
1: pins2lts-sym() [0x43b586]
2: /lib/x86_64-linux-gnu/libpthread.so.0(+0xf0a0) [0x7fab673b70a0]
3: pins2lts-sym(bitvector_is_set+0x18) [0x46ccb8]
4: pins2lts-sym(dm_set+0x61) [0x46d431]
5: /home/mcc/execution/model.so(pins_model_init+0xa80) [0x7fa8ea87d4f0]
6: pins2lts-sym(PINSpluginLoadGreyboxModel+0xbc) [0x42f25c]
7: pins2lts-sym(GBloadFile+0x8b) [0x445e5b]
8: pins2lts-sym() [0x41bfd6]
9: pins2lts-sym(actual_main_CALL+0x42) [0x42cbe2]
10: /home/mcc/gitprojects/ltsmin/sylvan/.libs/libsylvan.so.0(+0x27cc3) [0x7fab682cfcc3]
11: /lib/x86_64-linux-gnu/libpthread.so.0(+0x6b50) [0x7fab673aeb50]
12: /lib/x86_64-linux-gnu/libc.so.6(clone+0x6d) [0x7fab6694c7bd]
Sequence of Actions to be Executed by the VM
This is useful if one wants to reexecute the tool in the VM from the submitted image disk.
set -x
# this is for BenchKit: configuration of major elements for the test
export BK_INPUT="GlobalResAllocation-PT-05"
export BK_EXAMINATION="ReachabilityDeadlock"
export BK_TOOL="ltsmin"
export BK_RESULT_DIR="/users/gast00/fkordon/BK_RESULTS/OUTPUTS"
export BK_TIME_CONFINEMENT="3600"
export BK_MEMORY_CONFINEMENT="16384"
# this is specific to your benchmark or test
export BIN_DIR="$HOME/BenchKit/bin"
# remove the execution directoty if it exists (to avoid increse of .vmdk images)
if [ -d execution ] ; then
rm -rf execution
fi
tar xzf /home/mcc/BenchKit/INPUTS/GlobalResAllocation-PT-05.tgz
mv GlobalResAllocation-PT-05 execution
# this is for BenchKit: explicit launching of the test
cd execution
echo "====================================================================="
echo " Generated by BenchKit 2-2265"
echo " Executing tool ltsmin"
echo " Input is GlobalResAllocation-PT-05, examination is ReachabilityDeadlock"
echo " Time confinement is $BK_TIME_CONFINEMENT seconds"
echo " Memory confinement is 16384 MBytes"
echo " Number of cores is 4"
echo " Run identifier is r049kn-ebro-143236500800310"
echo "====================================================================="
echo
echo "--------------------"
echo "content from stdout:"
echo
echo "=== Data for post analysis generated by BenchKit (invocation template)"
echo
if [ "ReachabilityDeadlock" = "ReachabilityComputeBounds" ] ; then
echo "The expected result is a vector of positive values"
echo NUM_VECTOR
elif [ "ReachabilityDeadlock" != "StateSpace" ] ; then
echo "The expected result is a vector of booleans"
echo BOOL_VECTOR
else
echo "no data necessary for post analysis"
fi
echo
if [ -f "ReachabilityDeadlock.txt" ] ; then
echo "here is the order used to build the result vector(from text file)"
for x in $(grep Property ReachabilityDeadlock.txt | cut -d ' ' -f 2 | sort -u) ; do
echo "FORMULA_NAME $x"
done
elif [ -f "ReachabilityDeadlock.xml" ] ; then # for cunf (txt files deleted;-)
echo echo "here is the order used to build the result vector(from xml file)"
for x in $(grep '
echo "FORMULA_NAME $x"
done
fi
echo
echo "=== Now, execution of the tool begins"
echo
echo -n "BK_START "
date -u +%s%3N
echo
timeout -s 9 $BK_TIME_CONFINEMENT bash -c "/home/mcc/BenchKit/BenchKit_head.sh 2> STDERR ; echo ; echo -n \"BK_STOP \" ; date -u +%s%3N"
if [ $? -eq 137 ] ; then
echo
echo "BK_TIME_CONFINEMENT_REACHED"
fi
echo
echo "--------------------"
echo "content from stderr:"
echo
cat STDERR ;

