

About the Execution of Tapaal for SwimmingPool-PT-10
| Execution Summary | |||||
| Max Memory Used (MB) |
Time wait (ms) | CPU Usage (ms) | I/O Wait (ms) | Computed Result | Execution Status |
| 16228.651 | 1791870.00 | 4099299.00 | 9069.80 | [undef] | Cannot compute |
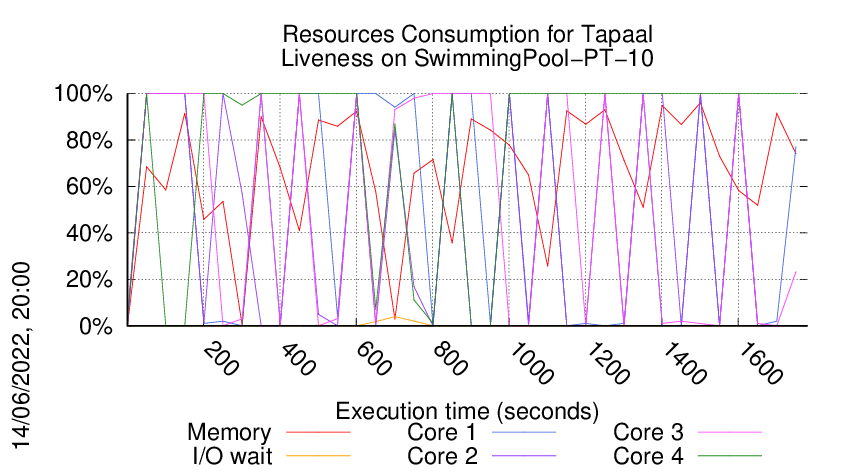
Execution Chart
We display below the execution chart for this examination (boot time has been removed).
Trace from the execution
Formatting '/data/fkordon/mcc2022-input.r262-tall-165303549100274.qcow2', fmt=qcow2 size=4294967296 backing_file=/data/fkordon/mcc2022-input.qcow2 cluster_size=65536 lazy_refcounts=off refcount_bits=16
Waiting for the VM to be ready (probing ssh)
................................................................................................................................................................................................
=====================================================================
Generated by BenchKit 2-4028
Executing tool tapaal
Input is SwimmingPool-PT-10, examination is Liveness
Time confinement is 1800 seconds
Memory confinement is 16384 MBytes
Number of cores is 4
Run identifier is r262-tall-165303549100274
=====================================================================
--------------------
preparation of the directory to be used:
/home/mcc/execution
total 216K
-rw-r--r-- 1 mcc users 6.8K Apr 29 12:53 CTLCardinality.txt
-rw-r--r-- 1 mcc users 70K Apr 29 12:53 CTLCardinality.xml
-rw-r--r-- 1 mcc users 5.0K Apr 29 12:52 CTLFireability.txt
-rw-r--r-- 1 mcc users 42K Apr 29 12:52 CTLFireability.xml
-rw-r--r-- 1 mcc users 6 May 10 09:34 equiv_col
-rw-r--r-- 1 mcc users 4.2K May 10 09:34 GenericPropertiesDefinition.xml
-rw-r--r-- 1 mcc users 3 May 10 09:34 instance
-rw-r--r-- 1 mcc users 6 May 10 09:34 iscolored
-rw-r--r-- 1 mcc users 3.7K May 9 09:14 LTLCardinality.txt
-rw-r--r-- 1 mcc users 24K May 9 09:14 LTLCardinality.xml
-rw-r--r-- 1 mcc users 2.3K May 9 09:14 LTLFireability.txt
-rw-r--r-- 1 mcc users 18K May 9 09:14 LTLFireability.xml
-rw-r--r-- 1 mcc users 3.9K May 10 09:34 model.pnml
-rw-r--r-- 1 mcc users 1.7K May 9 09:14 UpperBounds.txt
-rw-r--r-- 1 mcc users 3.7K May 9 09:14 UpperBounds.xml
--------------------
content from stdout:
=== Data for post analysis generated by BenchKit (invocation template)
The expected result is a vector of booleans
BOOL_VECTOR
FORMULA_NAME Liveness
=== Now, execution of the tool begins
BK_START 1653067418701
tapaal
Got BK_BIN_PATH=/home/mcc/BenchKit/bin/
---> tapaal --- TAPAAL v5
Setting MODEL_PATH=.
Setting VERIFYPN=/home/mcc/BenchKit/bin/verifypn
Got BK_TIME_CONFINEMENT=1800
Setting TEMPDIR=/home/mcc/BenchKit/bin/tmp
Got BK_MEMORY_CONFINEMENT=16384
Limiting to 16265216 kB
Total timeout: 1790
Time left: 1790
**********************************************
* TAPAAL checking for Liveness *
**********************************************
TEMPDIR=/home/mcc/BenchKit/bin/tmp
QF=/home/mcc/BenchKit/bin/tmp/tmp.uCil41MlXR
MF=/home/mcc/BenchKit/bin/tmp/tmp.gMZHKMPCHD
Time left: 1790
---------------------------------------------------
Step -1: Stripping Colors
---------------------------------------------------
Verifying stripped models (1 in total)
/home/mcc/BenchKit/bin/verifypn -n -c -q 358 -l 14 -d 149 -z 4 -x 1 ./model.pnml /home/mcc/BenchKit/bin/Liveness.xml
CPN OverApproximation is only usable on colored models
Time left: 1790
---------------------------------------------------
Step 0: Parallel Simplification
---------------------------------------------------
Doing parallel simplification (1 in total)
Total simplification timout is 358 -- reduction timeout is 149
timeout 1790 /home/mcc/BenchKit/bin/verifypn -n -q 358 -l 14 -d 149 -z 4 -s OverApprox --binary-query-io 2 --write-simplified /home/mcc/BenchKit/bin/tmp/tmp.uCil41MlXR --write-reduced /home/mcc/BenchKit/bin/tmp/tmp.gMZHKMPCHD -x 1 ./model.pnml /home/mcc/BenchKit/bin/Liveness.xml
Time left: 1790
---------------------------------------------------
Step 1: Parallel processing
---------------------------------------------------
Doing parallel verification of individual queries (1 in total)
Each query is verified by 4 parallel strategies for 298 seconds
------------------- QUERY 1 ----------------------
No solution found
Command terminated by signal 9
@@@71.28,9853180@@@
Command terminated by signal 9
@@@161.87,9674728@@@
Time left: 1489
---------------------------------------------------
Step 2: Sequential processing
---------------------------------------------------
Remaining 1 queries are verified sequentially.
Each query is verified for a dynamic timeout (at least 0 seconds)
Time left: 1489
Time left: 1488
---------------------------------------------------
Step 4: Random Parallel processing
---------------------------------------------------
Doing random parallel verification of individual queries (1 in total)
Each query is verified by 4 parallel strategies for 1488 seconds
------------------- QUERY 1 ----------------------
No solution found
Command terminated by signal 9
@@@38.94,5203324@@@
Command terminated by signal 9
@@@53.46,5808304@@@
Command terminated by signal 9
@@@80.43,8466656@@@
terminate called after throwing an instance of 'std::bad_alloc'
what(): std::bad_alloc
Command terminated by signal 6
@@@138.73,15771876@@@
Time left: 1349
Time left: 1349
---------------------------------------------------
Step 4: Random Parallel processing
---------------------------------------------------
Doing random parallel verification of individual queries (1 in total)
Each query is verified by 4 parallel strategies for 1349 seconds
------------------- QUERY 1 ----------------------
No solution found
Command terminated by signal 9
@@@36.90,5022556@@@
Command terminated by signal 9
@@@49.39,6093096@@@
Command terminated by signal 9
@@@71.13,8460824@@@
terminate called after throwing an instance of 'std::bad_alloc'
what(): std::bad_alloc
Command terminated by signal 6
@@@128.38,15771784@@@
Time left: 1221
Time left: 1221
---------------------------------------------------
Step 4: Random Parallel processing
---------------------------------------------------
Doing random parallel verification of individual queries (1 in total)
Each query is verified by 4 parallel strategies for 1221 seconds
------------------- QUERY 1 ----------------------
No solution found
Command terminated by signal 9
@@@39.45,4855172@@@
Command terminated by signal 9
@@@52.39,6208712@@@
Command terminated by signal 9
@@@76.21,8213020@@@
terminate called after throwing an instance of 'std::bad_alloc'
what(): std::bad_alloc
Command terminated by signal 6
@@@136.46,15771920@@@
Time left: 1084
Time left: 1084
---------------------------------------------------
Step 4: Random Parallel processing
---------------------------------------------------
Doing random parallel verification of individual queries (1 in total)
Each query is verified by 4 parallel strategies for 1084 seconds
------------------- QUERY 1 ----------------------
No solution found
Command terminated by signal 9
@@@36.81,4850104@@@
Command terminated by signal 9
@@@52.02,5696044@@@
Command terminated by signal 9
@@@73.88,8346236@@@
terminate called after throwing an instance of 'std::bad_alloc'
what(): std::bad_alloc
Command terminated by signal 6
@@@133.84,15771804@@@
Time left: 950
Time left: 950
---------------------------------------------------
Step 4: Random Parallel processing
---------------------------------------------------
Doing random parallel verification of individual queries (1 in total)
Each query is verified by 4 parallel strategies for 950 seconds
------------------- QUERY 1 ----------------------
No solution found
Command terminated by signal 9
@@@44.60,4095812@@@
Command terminated by signal 9
@@@56.20,5423360@@@
Command terminated by signal 9
@@@76.44,8113012@@@
terminate called after throwing an instance of 'std::bad_alloc'
what(): std::bad_alloc
Command terminated by signal 6
@@@136.77,15769920@@@
Time left: 813
Time left: 813
---------------------------------------------------
Step 4: Random Parallel processing
---------------------------------------------------
Doing random parallel verification of individual queries (1 in total)
Each query is verified by 4 parallel strategies for 813 seconds
------------------- QUERY 1 ----------------------
No solution found
Command terminated by signal 9
@@@33.35,4087024@@@
Command terminated by signal 9
@@@44.31,5468180@@@
Command terminated by signal 9
@@@65.33,8112732@@@
terminate called after throwing an instance of 'std::bad_alloc'
what(): std::bad_alloc
Command terminated by signal 6
@@@127.11,15769988@@@
Time left: 685
Time left: 685
---------------------------------------------------
Step 4: Random Parallel processing
---------------------------------------------------
Doing random parallel verification of individual queries (1 in total)
Each query is verified by 4 parallel strategies for 685 seconds
------------------- QUERY 1 ----------------------
No solution found
Command terminated by signal 9
@@@30.54,4200956@@@
Command terminated by signal 9
@@@41.12,5452532@@@
Command terminated by signal 9
@@@61.45,8160252@@@
terminate called after throwing an instance of 'std::bad_alloc'
what(): std::bad_alloc
Command terminated by signal 6
@@@120.07,15771908@@@
Time left: 565
Time left: 565
---------------------------------------------------
Step 4: Random Parallel processing
---------------------------------------------------
Doing random parallel verification of individual queries (1 in total)
Each query is verified by 4 parallel strategies for 565 seconds
------------------- QUERY 1 ----------------------
No solution found
Command terminated by signal 9
@@@29.44,4258948@@@
Command terminated by signal 9
@@@39.94,5538304@@@
Command terminated by signal 9
@@@60.91,8083568@@@
terminate called after throwing an instance of 'std::bad_alloc'
what(): std::bad_alloc
Command terminated by signal 6
@@@118.42,15770080@@@
Time left: 446
Time left: 446
---------------------------------------------------
Step 4: Random Parallel processing
---------------------------------------------------
Doing random parallel verification of individual queries (1 in total)
Each query is verified by 4 parallel strategies for 446 seconds
------------------- QUERY 1 ----------------------
No solution found
Command terminated by signal 9
@@@37.95,5189712@@@
Command terminated by signal 9
@@@51.02,5525432@@@
Command terminated by signal 9
@@@71.36,8166604@@@
terminate called after throwing an instance of 'std::bad_alloc'
what(): std::bad_alloc
Command terminated by signal 6
@@@132.30,15769756@@@
Time left: 314
Time left: 314
---------------------------------------------------
Step 4: Random Parallel processing
---------------------------------------------------
Doing random parallel verification of individual queries (1 in total)
Each query is verified by 4 parallel strategies for 314 seconds
------------------- QUERY 1 ----------------------
No solution found
Command terminated by signal 9
@@@27.60,4104264@@@
Command terminated by signal 9
@@@37.29,5404688@@@
Command terminated by signal 9
@@@57.85,8076780@@@
terminate called after throwing an instance of 'std::bad_alloc'
what(): std::bad_alloc
Command terminated by signal 6
@@@116.67,15769944@@@
Time left: 197
Time left: 197
---------------------------------------------------
Step 4: Random Parallel processing
---------------------------------------------------
Doing random parallel verification of individual queries (1 in total)
Each query is verified by 4 parallel strategies for 197 seconds
------------------- QUERY 1 ----------------------
No solution found
Command terminated by signal 9
@@@32.63,4327348@@@
Command terminated by signal 9
@@@43.69,5677496@@@
Command terminated by signal 9
@@@66.07,8129960@@@
terminate called after throwing an instance of 'std::bad_alloc'
what(): std::bad_alloc
Command terminated by signal 6
@@@126.22,15771912@@@
Time left: 70
Time left: 70
---------------------------------------------------
Step 4: Random Parallel processing
---------------------------------------------------
Doing random parallel verification of individual queries (1 in total)
Each query is verified by 4 parallel strategies for 70 seconds
------------------- QUERY 1 ----------------------
No solution found
Command terminated by signal 9
@@@27.84,4104304@@@
Command terminated by signal 9
@@@37.84,5429684@@@
Command terminated by signal 9
@@@59.14,8082252@@@
Time left: -2
Out of time, terminating!
terminated-with-cleanup
BK_STOP 1653069210571
--------------------
content from stderr:
Sequence of Actions to be Executed by the VM
This is useful if one wants to reexecute the tool in the VM from the submitted image disk.
set -x
# this is for BenchKit: configuration of major elements for the test
export BK_INPUT="SwimmingPool-PT-10"
export BK_EXAMINATION="Liveness"
export BK_TOOL="tapaal"
export BK_RESULT_DIR="/tmp/BK_RESULTS/OUTPUTS"
export BK_TIME_CONFINEMENT="1800"
export BK_MEMORY_CONFINEMENT="16384"
export BK_BIN_PATH="/home/mcc/BenchKit/bin/"
# this is specific to your benchmark or test
export BIN_DIR="$HOME/BenchKit/bin"
# remove the execution directoty if it exists (to avoid increse of .vmdk images)
if [ -d execution ] ; then
rm -rf execution
fi
# this is for BenchKit: explicit launching of the test
echo "====================================================================="
echo " Generated by BenchKit 2-4028"
echo " Executing tool tapaal"
echo " Input is SwimmingPool-PT-10, examination is Liveness"
echo " Time confinement is $BK_TIME_CONFINEMENT seconds"
echo " Memory confinement is 16384 MBytes"
echo " Number of cores is 4"
echo " Run identifier is r262-tall-165303549100274"
echo "====================================================================="
echo
echo "--------------------"
echo "preparation of the directory to be used:"
tar xzf /home/mcc/BenchKit/INPUTS/SwimmingPool-PT-10.tgz
mv SwimmingPool-PT-10 execution
cd execution
if [ "Liveness" = "ReachabilityDeadlock" ] || [ "Liveness" = "UpperBounds" ] || [ "Liveness" = "QuasiLiveness" ] || [ "Liveness" = "StableMarking" ] || [ "Liveness" = "Liveness" ] || [ "Liveness" = "OneSafe" ] || [ "Liveness" = "StateSpace" ]; then
rm -f GenericPropertiesVerdict.xml
fi
pwd
ls -lh
echo
echo "--------------------"
echo "content from stdout:"
echo
echo "=== Data for post analysis generated by BenchKit (invocation template)"
echo
if [ "Liveness" = "UpperBounds" ] ; then
echo "The expected result is a vector of positive values"
echo NUM_VECTOR
elif [ "Liveness" != "StateSpace" ] ; then
echo "The expected result is a vector of booleans"
echo BOOL_VECTOR
else
echo "no data necessary for post analysis"
fi
echo
if [ -f "Liveness.txt" ] ; then
echo "here is the order used to build the result vector(from text file)"
for x in $(grep Property Liveness.txt | cut -d ' ' -f 2 | sort -u) ; do
echo "FORMULA_NAME $x"
done
elif [ -f "Liveness.xml" ] ; then # for cunf (txt files deleted;-)
echo echo "here is the order used to build the result vector(from xml file)"
for x in $(grep '
echo "FORMULA_NAME $x"
done
elif [ "Liveness" = "ReachabilityDeadlock" ] || [ "Liveness" = "QuasiLiveness" ] || [ "Liveness" = "StableMarking" ] || [ "Liveness" = "Liveness" ] || [ "Liveness" = "OneSafe" ] ; then
echo "FORMULA_NAME Liveness"
fi
echo
echo "=== Now, execution of the tool begins"
echo
echo -n "BK_START "
date -u +%s%3N
echo
timeout -s 9 $BK_TIME_CONFINEMENT bash -c "/home/mcc/BenchKit/BenchKit_head.sh 2> STDERR ; echo ; echo -n \"BK_STOP \" ; date -u +%s%3N"
if [ $? -eq 137 ] ; then
echo
echo "BK_TIME_CONFINEMENT_REACHED"
fi
echo
echo "--------------------"
echo "content from stderr:"
echo
cat STDERR ;