

About the Execution of Tapaal for SemanticWebServices-PT-S128P09
| Execution Summary | |||||
| Max Memory Used (MB) |
Time wait (ms) | CPU Usage (ms) | I/O Wait (ms) | Computed Result | Execution Status |
| 16227.224 | 3594015.00 | 7746610.00 | 4399.10 | TFFFFTFFF?FFFFFF | normal |
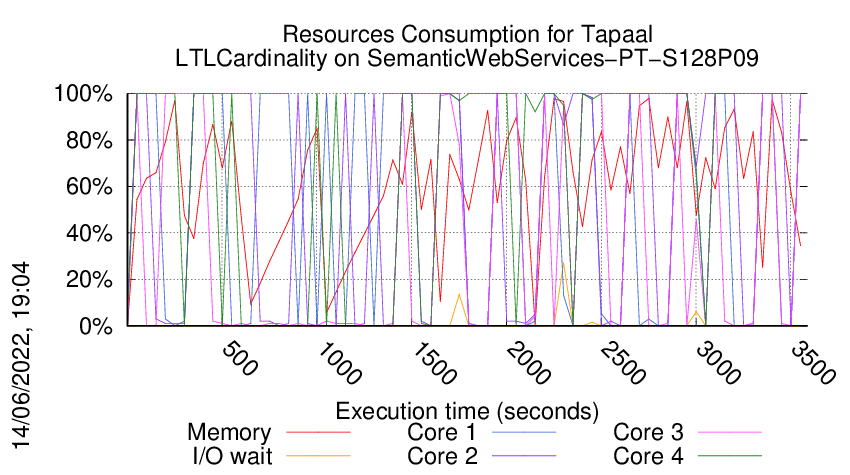
Execution Chart
We display below the execution chart for this examination (boot time has been removed).
Trace from the execution
Formatting '/data/fko/mcc2022-input.r201-oct2-165281596200387.qcow2', fmt=qcow2 size=4294967296 backing_file=/data/fko/mcc2022-input.qcow2 cluster_size=65536 lazy_refcounts=off refcount_bits=16
Waiting for the VM to be ready (probing ssh)
...............................................................................................................................................
=====================================================================
Generated by BenchKit 2-4028
Executing tool tapaal
Input is SemanticWebServices-PT-S128P09, examination is LTLCardinality
Time confinement is 3600 seconds
Memory confinement is 16384 MBytes
Number of cores is 4
Run identifier is r201-oct2-165281596200387
=====================================================================
--------------------
preparation of the directory to be used:
/home/mcc/execution
total 1.1M
-rw-r--r-- 1 mcc users 7.2K Apr 29 12:58 CTLCardinality.txt
-rw-r--r-- 1 mcc users 77K Apr 29 12:58 CTLCardinality.xml
-rw-r--r-- 1 mcc users 6.2K Apr 29 12:57 CTLFireability.txt
-rw-r--r-- 1 mcc users 56K Apr 29 12:57 CTLFireability.xml
-rw-r--r-- 1 mcc users 6 May 10 09:34 equiv_col
-rw-r--r-- 1 mcc users 8 May 10 09:34 instance
-rw-r--r-- 1 mcc users 6 May 10 09:34 iscolored
-rw-r--r-- 1 mcc users 3.5K May 9 08:43 LTLCardinality.txt
-rw-r--r-- 1 mcc users 24K May 9 08:43 LTLCardinality.xml
-rw-r--r-- 1 mcc users 2.4K May 9 08:43 LTLFireability.txt
-rw-r--r-- 1 mcc users 17K May 9 08:43 LTLFireability.xml
-rw-r--r-- 1 mcc users 814K May 10 09:34 model.pnml
-rw-r--r-- 1 mcc users 1.8K May 9 08:43 UpperBounds.txt
-rw-r--r-- 1 mcc users 3.9K May 9 08:43 UpperBounds.xml
--------------------
content from stdout:
=== Data for post analysis generated by BenchKit (invocation template)
The expected result is a vector of booleans
BOOL_VECTOR
here is the order used to build the result vector(from text file)
FORMULA_NAME SemanticWebServices-PT-S128P09-LTLCardinality-00
FORMULA_NAME SemanticWebServices-PT-S128P09-LTLCardinality-01
FORMULA_NAME SemanticWebServices-PT-S128P09-LTLCardinality-02
FORMULA_NAME SemanticWebServices-PT-S128P09-LTLCardinality-03
FORMULA_NAME SemanticWebServices-PT-S128P09-LTLCardinality-04
FORMULA_NAME SemanticWebServices-PT-S128P09-LTLCardinality-05
FORMULA_NAME SemanticWebServices-PT-S128P09-LTLCardinality-06
FORMULA_NAME SemanticWebServices-PT-S128P09-LTLCardinality-07
FORMULA_NAME SemanticWebServices-PT-S128P09-LTLCardinality-08
FORMULA_NAME SemanticWebServices-PT-S128P09-LTLCardinality-09
FORMULA_NAME SemanticWebServices-PT-S128P09-LTLCardinality-10
FORMULA_NAME SemanticWebServices-PT-S128P09-LTLCardinality-11
FORMULA_NAME SemanticWebServices-PT-S128P09-LTLCardinality-12
FORMULA_NAME SemanticWebServices-PT-S128P09-LTLCardinality-13
FORMULA_NAME SemanticWebServices-PT-S128P09-LTLCardinality-14
FORMULA_NAME SemanticWebServices-PT-S128P09-LTLCardinality-15
=== Now, execution of the tool begins
BK_START 1652843574008
tapaal
Got BK_BIN_PATH=/home/mcc/BenchKit/bin/
---> tapaal --- TAPAAL v5
Setting MODEL_PATH=.
Setting VERIFYPN=/home/mcc/BenchKit/bin/verifypn
Got BK_TIME_CONFINEMENT=3600
Setting TEMPDIR=/home/mcc/BenchKit/bin/tmp
Got BK_MEMORY_CONFINEMENT=16384
Limiting to 16265216 kB
Total timeout: 3590
Time left: 3590
*************************************
* TAPAAL verifying LTLCardinality *
*************************************
TEMPDIR=/home/mcc/BenchKit/bin/tmp
QF=/home/mcc/BenchKit/bin/tmp/tmp.EEYdm3gwb8
MF=/home/mcc/BenchKit/bin/tmp/tmp.QGunVfFglS
Time left: 3590
---------------------------------------------------
Step -1: Stripping Colors
---------------------------------------------------
Verifying stripped models (16 in total)
/home/mcc/BenchKit/bin/verifypn -n -c -q 718 -ltl -l 29 -d 299 -z 4 -x 1,2,3,4,5,6,7,8,9,10,11,12,13,14,15,16 ./model.pnml ./LTLCardinality.xml
CPN OverApproximation is only usable on colored models
Time left: 3590
---------------------------------------------------
Step 0: Parallel Simplification
---------------------------------------------------
Doing parallel simplification (16 in total)
Total simplification timout is 718 -- reduction timeout is 299
timeout 1017 /home/mcc/BenchKit/bin/verifypn -n -ltl -q 718 -l 29 -d 299 -z 4 -s OverApprox --binary-query-io 2 --write-simplified /home/mcc/BenchKit/bin/tmp/tmp.EEYdm3gwb8 --write-reduced /home/mcc/BenchKit/bin/tmp/tmp.QGunVfFglS -x 1,2,3,4,5,6,7,8,9,10,11,12,13,14,15,16 ./model.pnml ./LTLCardinality.xml
FORMULA SemanticWebServices-PT-S128P09-LTLCardinality-00 TRUE TECHNIQUES COLLATERAL_PROCESSING STRUCTURAL_REDUCTION QUERY_REDUCTION SAT_SMT LP_APPROX
Query index 0 was solved
Query is satisfied.
FORMULA SemanticWebServices-PT-S128P09-LTLCardinality-02 FALSE TECHNIQUES COLLATERAL_PROCESSING STRUCTURAL_REDUCTION QUERY_REDUCTION SAT_SMT LP_APPROX
Query index 2 was solved
Query is NOT satisfied.
FORMULA SemanticWebServices-PT-S128P09-LTLCardinality-05 TRUE TECHNIQUES COLLATERAL_PROCESSING STRUCTURAL_REDUCTION QUERY_REDUCTION SAT_SMT LP_APPROX
Query index 5 was solved
Query is satisfied.
FORMULA SemanticWebServices-PT-S128P09-LTLCardinality-10 FALSE TECHNIQUES COLLATERAL_PROCESSING STRUCTURAL_REDUCTION QUERY_REDUCTION SAT_SMT LP_APPROX
Query index 10 was solved
Query is NOT satisfied.
FORMULA SemanticWebServices-PT-S128P09-LTLCardinality-11 FALSE TECHNIQUES COLLATERAL_PROCESSING STRUCTURAL_REDUCTION QUERY_REDUCTION SAT_SMT LP_APPROX
Query index 11 was solved
Query is NOT satisfied.
Solution found by parallel simplification (step 0)
Solution found by parallel simplification (step 0)
Solution found by parallel simplification (step 0)
Solution found by parallel simplification (step 0)
Solution found by parallel simplification (step 0)
Time left: 3590
---------------------------------------------------
Step 1: Parallel processing
---------------------------------------------------
Doing parallel verification of individual queries (11 in total)
Each query is verified by 4 parallel strategies for 299 seconds
------------------- QUERY 1 ----------------------
Solution found by parallel processing (step 1)
Query index 0 was solved
Query is NOT satisfied.
Spent 0.055792 on verification
@@@0.06,149200@@@
FORMULA SemanticWebServices-PT-S128P09-LTLCardinality-03 FALSE TECHNIQUES EXPLICIT TARJAN WEAK_SKIP STUBBORN AUT_STUB HEURISTIC LOGFIRECOUNT_HEUR(5000) OPTIM-1
Query index 0 was solved
Query is NOT satisfied.
Spent 0.057595 on verification
@@@0.06,148932@@@
parallel: This job succeeded:
eval /usr/bin/time -f "@@@%e,%M@@@" /home/mcc/BenchKit/bin/verifypn -n -ltl\ tarjan\ --ltl-heur\ dist\ -q\ 0\ -l\ 0\ -d\ 119 /home/mcc/BenchKit/bin/tmp/tmp.QGunVfFglS /home/mcc/BenchKit/bin/tmp/tmp.EEYdm3gwb8 --binary-query-io 1 -x 1 -n
parallel: This job succeeded:
eval /usr/bin/time -f "@@@%e,%M@@@" /home/mcc/BenchKit/bin/verifypn -n -ltl\ tarjan\ --ltl-heur\ fire-count\ -q\ 0\ -l\ 0\ -d\ 119 /home/mcc/BenchKit/bin/tmp/tmp.QGunVfFglS /home/mcc/BenchKit/bin/tmp/tmp.EEYdm3gwb8 --binary-query-io 1 -x 1 -n
FORMULA SemanticWebServices-PT-S128P09-LTLCardinality-03 FALSE TECHNIQUES EXPLICIT TARJAN WEAK_SKIP STUBBORN AUT_STUB HEURISTIC DIST_HEUR OPTIM-1
Time left: 3590
------------------- QUERY 2 ----------------------
Solution found by parallel processing (step 1)
Query index 0 was solved
Query is NOT satisfied.
Spent 0.061613 on verification
@@@0.06,149148@@@
parallel: This job succeeded:
eval /usr/bin/time -f "@@@%e,%M@@@" /home/mcc/BenchKit/bin/verifypn -n -ltl\ tarjan\ --ltl-heur\ dist\ -q\ 0\ -l\ 0\ -d\ 119 /home/mcc/BenchKit/bin/tmp/tmp.QGunVfFglS /home/mcc/BenchKit/bin/tmp/tmp.EEYdm3gwb8 --binary-query-io 1 -x 2 -n
FORMULA SemanticWebServices-PT-S128P09-LTLCardinality-06 FALSE TECHNIQUES EXPLICIT TARJAN WEAK_SKIP STUBBORN AUT_STUB HEURISTIC DIST_HEUR OPTIM-1
Time left: 3590
------------------- QUERY 3 ----------------------
Solution found by parallel processing (step 1)
Query index 0 was solved
Query is NOT satisfied.
Spent 0.061805 on verification
@@@0.08,149104@@@
parallel: This job succeeded:
eval /usr/bin/time -f "@@@%e,%M@@@" /home/mcc/BenchKit/bin/verifypn -n -ltl\ tarjan\ --ltl-heur\ dist\ -q\ 0\ -l\ 0\ -d\ 119 /home/mcc/BenchKit/bin/tmp/tmp.QGunVfFglS /home/mcc/BenchKit/bin/tmp/tmp.EEYdm3gwb8 --binary-query-io 1 -x 3 -n
FORMULA SemanticWebServices-PT-S128P09-LTLCardinality-08 FALSE TECHNIQUES EXPLICIT TARJAN WEAK_SKIP STUBBORN AUT_STUB HEURISTIC DIST_HEUR OPTIM-1
Time left: 3589
------------------- QUERY 4 ----------------------
Solution found by parallel processing (step 1)
Query index 0 was solved
Query is NOT satisfied.
Spent 0.06222 on verification
@@@0.06,149116@@@
parallel: This job succeeded:
eval /usr/bin/time -f "@@@%e,%M@@@" /home/mcc/BenchKit/bin/verifypn -n -ltl\ tarjan\ --ltl-heur\ aut\ -s\ DFS\ -p\ -q\ 0\ -l\ 0\ -d\ 119 /home/mcc/BenchKit/bin/tmp/tmp.QGunVfFglS /home/mcc/BenchKit/bin/tmp/tmp.EEYdm3gwb8 --binary-query-io 1 -x 4 -n
FORMULA SemanticWebServices-PT-S128P09-LTLCardinality-15 FALSE TECHNIQUES EXPLICIT TARJAN WEAK_SKIP OPTIM-1
Time left: 3589
------------------- QUERY 5 ----------------------
No solution found
Command terminated by signal 9
@@@91.96,6399684@@@
Command terminated by signal 9
@@@133.63,6597236@@@
Command terminated by signal 9
@@@254.37,10372864@@@
Time left: 3287
------------------- QUERY 6 ----------------------
No solution found
Command terminated by signal 9
@@@136.29,5827896@@@
Command terminated by signal 9
@@@178.68,6620388@@@
Command terminated by signal 9
@@@273.75,9167768@@@
Time left: 2985
------------------- QUERY 7 ----------------------
Solution found by parallel processing (step 1)
Query index 0 was solved
Query is NOT satisfied.
Spent 0.016653 on verification
@@@0.03,21368@@@
parallel: This job succeeded:
eval /usr/bin/time -f "@@@%e,%M@@@" /home/mcc/BenchKit/bin/verifypn -n -ltl\ ndfs\ -q\ 0\ -l\ 0\ -d\ 119 /home/mcc/BenchKit/bin/tmp/tmp.QGunVfFglS /home/mcc/BenchKit/bin/tmp/tmp.EEYdm3gwb8 --binary-query-io 1 -x 7 -n
FORMULA SemanticWebServices-PT-S128P09-LTLCardinality-01 FALSE TECHNIQUES EXPLICIT NDFS WEAK_SKIP HEURISTIC AUTOMATON_HEUR OPTIM-1
Time left: 2985
------------------- QUERY 8 ----------------------
Solution found by parallel processing (step 1)
Query index 0 was solved
Query is NOT satisfied.
Spent 0.014452 on verification
@@@0.01,21652@@@
parallel: This job succeeded:
eval /usr/bin/time -f "@@@%e,%M@@@" /home/mcc/BenchKit/bin/verifypn -n -ltl\ ndfs\ -q\ 0\ -l\ 0\ -d\ 119 /home/mcc/BenchKit/bin/tmp/tmp.QGunVfFglS /home/mcc/BenchKit/bin/tmp/tmp.EEYdm3gwb8 --binary-query-io 1 -x 8 -n
FORMULA SemanticWebServices-PT-S128P09-LTLCardinality-13 FALSE TECHNIQUES EXPLICIT NDFS WEAK_SKIP HEURISTIC AUTOMATON_HEUR OPTIM-1
Time left: 2985
------------------- QUERY 9 ----------------------
Solution found by parallel processing (step 1)
Query index 0 was solved
Query is NOT satisfied.
FORMULA SemanticWebServices-PT-S128P09-LTLCardinality-04 FALSE TECHNIQUES EXPLICIT TARJAN WEAK_SKIP STUBBORN AUT_STUB HEURISTIC DIST_HEUR OPTIM-1
Query index 0 was solved
Query is NOT satisfied.
Spent 0.053906 on verification
Spent 0.0553 on verification
@@@0.05,149112@@@
@@@0.06,149124@@@
parallel: This job succeeded:
eval /usr/bin/time -f "@@@%e,%M@@@" /home/mcc/BenchKit/bin/verifypn -n -ltl\ tarjan\ --ltl-heur\ dist\ -q\ 0\ -l\ 0\ -d\ 119 /home/mcc/BenchKit/bin/tmp/tmp.QGunVfFglS /home/mcc/BenchKit/bin/tmp/tmp.EEYdm3gwb8 --binary-query-io 1 -x 9 -n
parallel: This job succeeded:
eval /usr/bin/time -f "@@@%e,%M@@@" /home/mcc/BenchKit/bin/verifypn -n -ltl\ tarjan\ --ltl-heur\ fire-count\ -q\ 0\ -l\ 0\ -d\ 119 /home/mcc/BenchKit/bin/tmp/tmp.QGunVfFglS /home/mcc/BenchKit/bin/tmp/tmp.EEYdm3gwb8 --binary-query-io 1 -x 9 -n
FORMULA SemanticWebServices-PT-S128P09-LTLCardinality-04 FALSE TECHNIQUES EXPLICIT TARJAN WEAK_SKIP STUBBORN AUT_STUB HEURISTIC LOGFIRECOUNT_HEUR(5000) OPTIM-1
Time left: 2985
------------------- QUERY 10 ----------------------
Solution found by parallel processing (step 1)
Query index 0 was solved
Query is NOT satisfied.
Spent 0.05107 on verification
@@@0.05,149184@@@
parallel: This job succeeded:
eval /usr/bin/time -f "@@@%e,%M@@@" /home/mcc/BenchKit/bin/verifypn -n -ltl\ tarjan\ --ltl-heur\ dist\ -q\ 0\ -l\ 0\ -d\ 119 /home/mcc/BenchKit/bin/tmp/tmp.QGunVfFglS /home/mcc/BenchKit/bin/tmp/tmp.EEYdm3gwb8 --binary-query-io 1 -x 10 -n
FORMULA SemanticWebServices-PT-S128P09-LTLCardinality-14 FALSE TECHNIQUES EXPLICIT TARJAN WEAK_SKIP STUBBORN AUT_STUB HEURISTIC DIST_HEUR OPTIM-1
Time left: 2985
------------------- QUERY 11 ----------------------
Solution found by parallel processing (step 1)
Query index 0 was solved
Query is NOT satisfied.
Spent 0.052459 on verification
@@@0.05,149232@@@
parallel: This job succeeded:
eval /usr/bin/time -f "@@@%e,%M@@@" /home/mcc/BenchKit/bin/verifypn -n -ltl\ tarjan\ --ltl-heur\ aut\ -s\ DFS\ -p\ -q\ 0\ -l\ 0\ -d\ 119 /home/mcc/BenchKit/bin/tmp/tmp.QGunVfFglS /home/mcc/BenchKit/bin/tmp/tmp.EEYdm3gwb8 --binary-query-io 1 -x 11 -n
FORMULA SemanticWebServices-PT-S128P09-LTLCardinality-12 FALSE TECHNIQUES EXPLICIT TARJAN WEAK_SKIP OPTIM-1
Time left: 2984
---------------------------------------------------
Step 2: Sequential processing
---------------------------------------------------
Remaining 2 queries are verified sequentially.
Each query is verified for a dynamic timeout (at least 512 seconds)
Time left: 2984
------------------- QUERY 5 ----------------------
Running query 5 for 1492 seconds. Remaining: 2 queries and 2984 seconds
No solution found
terminate called after throwing an instance of 'std::bad_alloc'
what(): std::bad_alloc
Command terminated by signal 6
@@@418.41,14516864@@@
Time left: 2566
------------------- QUERY 6 ----------------------
Running query 6 for 2566 seconds. Remaining: 1 queries and 2566 seconds
No solution found
terminate called after throwing an instance of 'std::bad_alloc'
what(): std::bad_alloc
Command terminated by signal 6
@@@382.68,13723192@@@
Time left: 2183
Time left: 2183
---------------------------------------------------
Step 4: Random Parallel processing
---------------------------------------------------
Doing random parallel verification of individual queries (2 in total)
Each query is verified by 4 parallel strategies for 1091 seconds
------------------- QUERY 5 ----------------------
No solution found
Command terminated by signal 9
@@@73.90,4832560@@@
Command terminated by signal 9
@@@98.91,5928024@@@
Command terminated by signal 9
@@@141.40,8131916@@@
Command terminated by signal 9
@@@238.18,16146476@@@
Time left: 1945
------------------- QUERY 6 ----------------------
No solution found
Command terminated by signal 9
@@@76.52,5228264@@@
Command terminated by signal 9
@@@105.39,5902136@@@
Command terminated by signal 9
@@@150.49,8415328@@@
terminate called after throwing an instance of 'std::bad_alloc'
what(): std::bad_alloc
Command terminated by signal 6
@@@264.52,15732036@@@
Time left: 1680
Time left: 1680
---------------------------------------------------
Step 4: Random Parallel processing
---------------------------------------------------
Doing random parallel verification of individual queries (2 in total)
Each query is verified by 4 parallel strategies for 840 seconds
------------------- QUERY 5 ----------------------
Solution found in random processing (step 4)
Query index 0 was solved
Query is NOT satisfied.
Spent 0.104914 on verification
@@@0.12,149724@@@
Query index 0 was solved
Query is NOT satisfied.
parallel: This job succeeded:
eval /usr/bin/time -f "@@@%e,%M@@@" /home/mcc/BenchKit/bin/verifypn -n -ltl\ tarjan\ -s\ RDFS\ --seed-offset\ 1337\ -p\ -q\ 0\ -l\ 0\ -d\ 119 /home/mcc/BenchKit/bin/tmp/tmp.QGunVfFglS /home/mcc/BenchKit/bin/tmp/tmp.EEYdm3gwb8 --binary-query-io 1 -x 5 -n
FORMULA SemanticWebServices-PT-S128P09-LTLCardinality-07 FALSE TECHNIQUES EXPLICIT TARJAN WEAK_SKIP HEURISTIC RANDOM_HEUR OPTIM-1
Time left: 1679
------------------- QUERY 6 ----------------------
No solution found
Command terminated by signal 9
@@@80.68,4960112@@@
Command terminated by signal 9
@@@107.66,5839624@@@
Command terminated by signal 9
@@@153.05,8172480@@@
terminate called after throwing an instance of 'std::bad_alloc'
what(): std::bad_alloc
Command terminated by signal 6
@@@240.67,15122096@@@
Time left: 1439
Time left: 1439
---------------------------------------------------
Step 4: Random Parallel processing
---------------------------------------------------
Doing random parallel verification of individual queries (1 in total)
Each query is verified by 4 parallel strategies for 1439 seconds
------------------- QUERY 6 ----------------------
No solution found
Command terminated by signal 9
@@@74.90,4964536@@@
Command terminated by signal 9
@@@101.90,5895656@@@
Command terminated by signal 9
@@@157.41,8339344@@@
terminate called after throwing an instance of 'std::bad_alloc'
what(): std::bad_alloc
Command terminated by signal 6
@@@229.20,14107632@@@
Time left: 1209
Time left: 1209
---------------------------------------------------
Step 4: Random Parallel processing
---------------------------------------------------
Doing random parallel verification of individual queries (1 in total)
Each query is verified by 4 parallel strategies for 1209 seconds
------------------- QUERY 6 ----------------------
No solution found
Command terminated by signal 9
@@@76.90,4525636@@@
Command terminated by signal 9
@@@102.11,5976060@@@
Command terminated by signal 9
@@@152.48,8134552@@@
terminate called after throwing an instance of 'std::bad_alloc'
what(): std::bad_alloc
Command terminated by signal 6
@@@239.01,15122128@@@
Time left: 970
Time left: 970
---------------------------------------------------
Step 4: Random Parallel processing
---------------------------------------------------
Doing random parallel verification of individual queries (1 in total)
Each query is verified by 4 parallel strategies for 970 seconds
------------------- QUERY 6 ----------------------
No solution found
Command terminated by signal 9
@@@67.28,4375836@@@
Command terminated by signal 9
@@@91.48,5622236@@@
Command terminated by signal 9
@@@139.16,8262996@@@
Command terminated by signal 9
@@@244.75,16148624@@@
Time left: 725
Time left: 725
---------------------------------------------------
Step 4: Random Parallel processing
---------------------------------------------------
Doing random parallel verification of individual queries (1 in total)
Each query is verified by 4 parallel strategies for 725 seconds
------------------- QUERY 6 ----------------------
No solution found
Command terminated by signal 9
@@@70.12,4641896@@@
Command terminated by signal 9
@@@95.11,5962012@@@
Command terminated by signal 9
@@@142.43,8423016@@@
terminate called after throwing an instance of 'std::bad_alloc'
what(): std::bad_alloc
Command terminated by signal 6
@@@197.89,13999380@@@
Time left: 527
Time left: 527
---------------------------------------------------
Step 4: Random Parallel processing
---------------------------------------------------
Doing random parallel verification of individual queries (1 in total)
Each query is verified by 4 parallel strategies for 527 seconds
------------------- QUERY 6 ----------------------
No solution found
Command terminated by signal 9
@@@78.23,5316696@@@
Command terminated by signal 9
@@@107.06,5788052@@@
Command terminated by signal 9
@@@147.96,8896688@@@
terminate called after throwing an instance of 'std::bad_alloc'
what(): std::bad_alloc
Command terminated by signal 6
@@@279.27,15882532@@@
Time left: 247
Time left: 247
---------------------------------------------------
Step 4: Random Parallel processing
---------------------------------------------------
Doing random parallel verification of individual queries (1 in total)
Each query is verified by 4 parallel strategies for 247 seconds
------------------- QUERY 6 ----------------------
No solution found
Command terminated by signal 9
@@@66.90,4392724@@@
Command terminated by signal 9
@@@90.64,5662892@@@
Command terminated by signal 9
@@@136.74,8579056@@@
terminate called after throwing an instance of 'std::bad_alloc'
what(): std::bad_alloc
Command terminated by signal 6
@@@194.38,13999928@@@
Time left: 53
Time left: 53
---------------------------------------------------
Step 4: Random Parallel processing
---------------------------------------------------
Doing random parallel verification of individual queries (1 in total)
Each query is verified by 4 parallel strategies for 53 seconds
------------------- QUERY 6 ----------------------
No solution found
Time left: -4
Out of time, terminating!
terminated-with-cleanup
BK_STOP 1652847168023
--------------------
content from stderr:
Sequence of Actions to be Executed by the VM
This is useful if one wants to reexecute the tool in the VM from the submitted image disk.
set -x
# this is for BenchKit: configuration of major elements for the test
export BK_INPUT="SemanticWebServices-PT-S128P09"
export BK_EXAMINATION="LTLCardinality"
export BK_TOOL="tapaal"
export BK_RESULT_DIR="/tmp/BK_RESULTS/OUTPUTS"
export BK_TIME_CONFINEMENT="3600"
export BK_MEMORY_CONFINEMENT="16384"
export BK_BIN_PATH="/home/mcc/BenchKit/bin/"
# this is specific to your benchmark or test
export BIN_DIR="$HOME/BenchKit/bin"
# remove the execution directoty if it exists (to avoid increse of .vmdk images)
if [ -d execution ] ; then
rm -rf execution
fi
# this is for BenchKit: explicit launching of the test
echo "====================================================================="
echo " Generated by BenchKit 2-4028"
echo " Executing tool tapaal"
echo " Input is SemanticWebServices-PT-S128P09, examination is LTLCardinality"
echo " Time confinement is $BK_TIME_CONFINEMENT seconds"
echo " Memory confinement is 16384 MBytes"
echo " Number of cores is 4"
echo " Run identifier is r201-oct2-165281596200387"
echo "====================================================================="
echo
echo "--------------------"
echo "preparation of the directory to be used:"
tar xzf /home/mcc/BenchKit/INPUTS/SemanticWebServices-PT-S128P09.tgz
mv SemanticWebServices-PT-S128P09 execution
cd execution
if [ "LTLCardinality" = "ReachabilityDeadlock" ] || [ "LTLCardinality" = "UpperBounds" ] || [ "LTLCardinality" = "QuasiLiveness" ] || [ "LTLCardinality" = "StableMarking" ] || [ "LTLCardinality" = "Liveness" ] || [ "LTLCardinality" = "OneSafe" ] || [ "LTLCardinality" = "StateSpace" ]; then
rm -f GenericPropertiesVerdict.xml
fi
pwd
ls -lh
echo
echo "--------------------"
echo "content from stdout:"
echo
echo "=== Data for post analysis generated by BenchKit (invocation template)"
echo
if [ "LTLCardinality" = "UpperBounds" ] ; then
echo "The expected result is a vector of positive values"
echo NUM_VECTOR
elif [ "LTLCardinality" != "StateSpace" ] ; then
echo "The expected result is a vector of booleans"
echo BOOL_VECTOR
else
echo "no data necessary for post analysis"
fi
echo
if [ -f "LTLCardinality.txt" ] ; then
echo "here is the order used to build the result vector(from text file)"
for x in $(grep Property LTLCardinality.txt | cut -d ' ' -f 2 | sort -u) ; do
echo "FORMULA_NAME $x"
done
elif [ -f "LTLCardinality.xml" ] ; then # for cunf (txt files deleted;-)
echo echo "here is the order used to build the result vector(from xml file)"
for x in $(grep '
echo "FORMULA_NAME $x"
done
elif [ "LTLCardinality" = "ReachabilityDeadlock" ] || [ "LTLCardinality" = "QuasiLiveness" ] || [ "LTLCardinality" = "StableMarking" ] || [ "LTLCardinality" = "Liveness" ] || [ "LTLCardinality" = "OneSafe" ] ; then
echo "FORMULA_NAME LTLCardinality"
fi
echo
echo "=== Now, execution of the tool begins"
echo
echo -n "BK_START "
date -u +%s%3N
echo
timeout -s 9 $BK_TIME_CONFINEMENT bash -c "/home/mcc/BenchKit/BenchKit_head.sh 2> STDERR ; echo ; echo -n \"BK_STOP \" ; date -u +%s%3N"
if [ $? -eq 137 ] ; then
echo
echo "BK_TIME_CONFINEMENT_REACHED"
fi
echo
echo "--------------------"
echo "content from stderr:"
echo
cat STDERR ;