

About the Execution of Tapaal for Kanban-PT-10000
| Execution Summary | |||||
| Max Memory Used (MB) |
Time wait (ms) | CPU Usage (ms) | I/O Wait (ms) | Computed Result | Execution Status |
| 16225.107 | 1793160.00 | 4574601.00 | 8164.00 | [undef] | Cannot compute |
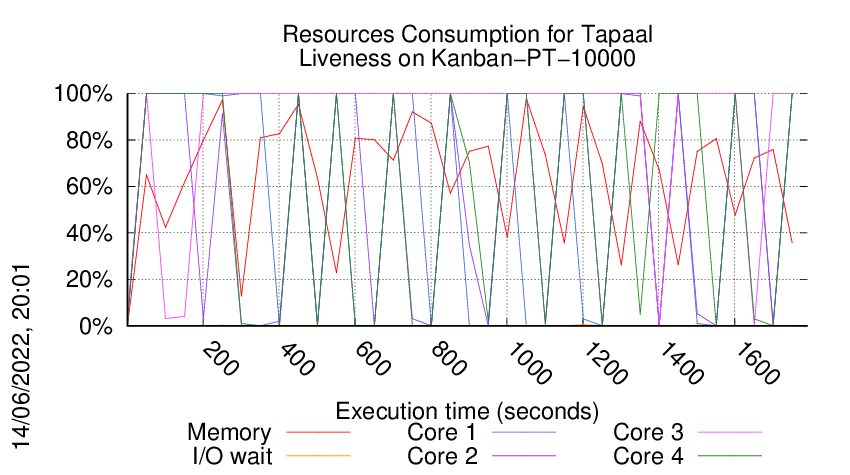
Execution Chart
We display below the execution chart for this examination (boot time has been removed).
Trace from the execution
Formatting '/data/fkordon/mcc2022-input.r136-tall-165271825000199.qcow2', fmt=qcow2 size=4294967296 backing_file=/data/fkordon/mcc2022-input.qcow2 cluster_size=65536 lazy_refcounts=off refcount_bits=16
Waiting for the VM to be ready (probing ssh)
........................................................................................................................................................................................................................................................................................................................................................................................................................................................................................................................................................................................................................................................................................................................................................................................................................................................................................................................................................................................................................................................................................................................................................................................................................................................................................................................................................................................................................................................................................................................................................................................................................................................................................................................................................................................................................................................................................................................................................................................................
=====================================================================
Generated by BenchKit 2-4028
Executing tool tapaal
Input is Kanban-PT-10000, examination is Liveness
Time confinement is 1800 seconds
Memory confinement is 16384 MBytes
Number of cores is 4
Run identifier is r136-tall-165271825000199
=====================================================================
--------------------
preparation of the directory to be used:
/home/mcc/execution
total 244K
-rw-r--r-- 1 mcc users 6.9K Apr 29 17:36 CTLCardinality.txt
-rw-r--r-- 1 mcc users 72K Apr 29 17:36 CTLCardinality.xml
-rw-r--r-- 1 mcc users 5.5K Apr 29 17:35 CTLFireability.txt
-rw-r--r-- 1 mcc users 49K Apr 29 17:35 CTLFireability.xml
-rw-r--r-- 1 mcc users 6 May 10 09:34 equiv_col
-rw-r--r-- 1 mcc users 4.2K May 10 09:34 GenericPropertiesDefinition.xml
-rw-r--r-- 1 mcc users 6 May 10 09:34 instance
-rw-r--r-- 1 mcc users 6 May 10 09:34 iscolored
-rw-r--r-- 1 mcc users 4.0K May 9 08:10 LTLCardinality.txt
-rw-r--r-- 1 mcc users 29K May 9 08:10 LTLCardinality.xml
-rw-r--r-- 1 mcc users 2.3K May 9 08:10 LTLFireability.txt
-rw-r--r-- 1 mcc users 18K May 9 08:10 LTLFireability.xml
-rw-r--r-- 1 mcc users 14K May 10 09:34 model.pnml
-rw-r--r-- 1 mcc users 1.6K May 9 08:10 UpperBounds.txt
-rw-r--r-- 1 mcc users 3.6K May 9 08:10 UpperBounds.xml
--------------------
content from stdout:
=== Data for post analysis generated by BenchKit (invocation template)
The expected result is a vector of booleans
BOOL_VECTOR
FORMULA_NAME Liveness
=== Now, execution of the tool begins
BK_START 1652747546552
tapaal
Got BK_BIN_PATH=/home/mcc/BenchKit/bin/
---> tapaal --- TAPAAL v5
Setting MODEL_PATH=.
Setting VERIFYPN=/home/mcc/BenchKit/bin/verifypn
Got BK_TIME_CONFINEMENT=1800
Setting TEMPDIR=/home/mcc/BenchKit/bin/tmp
Got BK_MEMORY_CONFINEMENT=16384
Limiting to 16265216 kB
Total timeout: 1790
Time left: 1790
**********************************************
* TAPAAL checking for Liveness *
**********************************************
TEMPDIR=/home/mcc/BenchKit/bin/tmp
QF=/home/mcc/BenchKit/bin/tmp/tmp.77iloZTUVD
MF=/home/mcc/BenchKit/bin/tmp/tmp.WrtHMJ3z5T
Time left: 1790
---------------------------------------------------
Step -1: Stripping Colors
---------------------------------------------------
Verifying stripped models (1 in total)
/home/mcc/BenchKit/bin/verifypn -n -c -q 358 -l 14 -d 149 -z 4 -x 1 ./model.pnml /home/mcc/BenchKit/bin/Liveness.xml
CPN OverApproximation is only usable on colored models
Time left: 1790
---------------------------------------------------
Step 0: Parallel Simplification
---------------------------------------------------
Doing parallel simplification (1 in total)
Total simplification timout is 358 -- reduction timeout is 149
timeout 1790 /home/mcc/BenchKit/bin/verifypn -n -q 358 -l 14 -d 149 -z 4 -s OverApprox --binary-query-io 2 --write-simplified /home/mcc/BenchKit/bin/tmp/tmp.77iloZTUVD --write-reduced /home/mcc/BenchKit/bin/tmp/tmp.WrtHMJ3z5T -x 1 ./model.pnml /home/mcc/BenchKit/bin/Liveness.xml
Time left: 1790
---------------------------------------------------
Step 1: Parallel processing
---------------------------------------------------
Doing parallel verification of individual queries (1 in total)
Each query is verified by 4 parallel strategies for 298 seconds
------------------- QUERY 1 ----------------------
No solution found
Command terminated by signal 9
@@@77.62,10602476@@@
Command terminated by signal 9
@@@257.31,14253060@@@
Time left: 1489
---------------------------------------------------
Step 2: Sequential processing
---------------------------------------------------
Remaining 1 queries are verified sequentially.
Each query is verified for a dynamic timeout (at least 0 seconds)
Time left: 1489
Time left: 1489
---------------------------------------------------
Step 4: Random Parallel processing
---------------------------------------------------
Doing random parallel verification of individual queries (1 in total)
Each query is verified by 4 parallel strategies for 1489 seconds
------------------- QUERY 1 ----------------------
No solution found
Command terminated by signal 9
@@@29.55,4085412@@@
Command terminated by signal 9
@@@39.70,5440224@@@
Command terminated by signal 9
@@@59.53,8115224@@@
Command terminated by signal 9
@@@119.08,16147616@@@
Time left: 1369
Time left: 1369
---------------------------------------------------
Step 4: Random Parallel processing
---------------------------------------------------
Doing random parallel verification of individual queries (1 in total)
Each query is verified by 4 parallel strategies for 1369 seconds
------------------- QUERY 1 ----------------------
No solution found
Command terminated by signal 9
@@@31.93,4094480@@@
Command terminated by signal 9
@@@42.11,5431848@@@
Command terminated by signal 9
@@@62.14,8132448@@@
Command terminated by signal 9
@@@121.99,16145260@@@
Time left: 1247
Time left: 1247
---------------------------------------------------
Step 4: Random Parallel processing
---------------------------------------------------
Doing random parallel verification of individual queries (1 in total)
Each query is verified by 4 parallel strategies for 1247 seconds
------------------- QUERY 1 ----------------------
No solution found
Command terminated by signal 9
@@@35.65,4691172@@@
Command terminated by signal 9
@@@47.64,5498460@@@
Command terminated by signal 9
@@@69.09,8202156@@@
Command terminated by signal 9
@@@130.01,16149468@@@
Time left: 1116
Time left: 1116
---------------------------------------------------
Step 4: Random Parallel processing
---------------------------------------------------
Doing random parallel verification of individual queries (1 in total)
Each query is verified by 4 parallel strategies for 1116 seconds
------------------- QUERY 1 ----------------------
No solution found
Command terminated by signal 9
@@@38.18,5002720@@@
Command terminated by signal 9
@@@57.47,6311148@@@
Command terminated by signal 9
@@@81.56,8118408@@@
Command terminated by signal 9
@@@141.05,16149332@@@
Time left: 975
Time left: 975
---------------------------------------------------
Step 4: Random Parallel processing
---------------------------------------------------
Doing random parallel verification of individual queries (1 in total)
Each query is verified by 4 parallel strategies for 975 seconds
------------------- QUERY 1 ----------------------
No solution found
Command terminated by signal 9
@@@61.61,4072196@@@
Command terminated by signal 9
@@@77.53,5933584@@@
Command terminated by signal 9
@@@101.93,8135628@@@
Command terminated by signal 9
@@@163.58,16145252@@@
Time left: 811
Time left: 811
---------------------------------------------------
Step 4: Random Parallel processing
---------------------------------------------------
Doing random parallel verification of individual queries (1 in total)
Each query is verified by 4 parallel strategies for 811 seconds
------------------- QUERY 1 ----------------------
No solution found
Command terminated by signal 9
@@@57.90,4049472@@@
Command terminated by signal 9
@@@73.11,5644720@@@
Command terminated by signal 9
@@@94.79,8110760@@@
Command terminated by signal 9
@@@151.29,16145148@@@
Time left: 660
Time left: 660
---------------------------------------------------
Step 4: Random Parallel processing
---------------------------------------------------
Doing random parallel verification of individual queries (1 in total)
Each query is verified by 4 parallel strategies for 660 seconds
------------------- QUERY 1 ----------------------
No solution found
Command terminated by signal 9
@@@58.64,4056996@@@
Command terminated by signal 9
@@@74.35,5486348@@@
Command terminated by signal 9
@@@96.99,8295168@@@
Command terminated by signal 9
@@@155.87,16148820@@@
Time left: 503
Time left: 503
---------------------------------------------------
Step 4: Random Parallel processing
---------------------------------------------------
Doing random parallel verification of individual queries (1 in total)
Each query is verified by 4 parallel strategies for 503 seconds
------------------- QUERY 1 ----------------------
No solution found
Command terminated by signal 9
@@@56.99,4059392@@@
Command terminated by signal 9
@@@72.65,5727732@@@
Command terminated by signal 9
@@@94.72,8102844@@@
Command terminated by signal 9
@@@153.19,16147512@@@
Time left: 350
Time left: 350
---------------------------------------------------
Step 4: Random Parallel processing
---------------------------------------------------
Doing random parallel verification of individual queries (1 in total)
Each query is verified by 4 parallel strategies for 350 seconds
------------------- QUERY 1 ----------------------
No solution found
Command terminated by signal 9
@@@42.19,4901244@@@
Command terminated by signal 9
@@@54.16,6207924@@@
Command terminated by signal 9
@@@76.42,8238384@@@
Command terminated by signal 9
@@@134.57,16147452@@@
Time left: 215
Time left: 215
---------------------------------------------------
Step 4: Random Parallel processing
---------------------------------------------------
Doing random parallel verification of individual queries (1 in total)
Each query is verified by 4 parallel strategies for 215 seconds
------------------- QUERY 1 ----------------------
No solution found
Command terminated by signal 9
@@@56.91,4148612@@@
Command terminated by signal 9
@@@73.34,5574884@@@
Command terminated by signal 9
@@@95.25,8152272@@@
Command terminated by signal 9
@@@156.76,16145644@@@
Time left: 58
Time left: 58
---------------------------------------------------
Step 4: Random Parallel processing
---------------------------------------------------
Doing random parallel verification of individual queries (1 in total)
Each query is verified by 4 parallel strategies for 58 seconds
------------------- QUERY 1 ----------------------
No solution found
Command terminated by signal 9
@@@58.85,4067248@@@
Time left: -3
Out of time, terminating!
terminated-with-cleanup
BK_STOP 1652749339712
--------------------
content from stderr:
Sequence of Actions to be Executed by the VM
This is useful if one wants to reexecute the tool in the VM from the submitted image disk.
set -x
# this is for BenchKit: configuration of major elements for the test
export BK_INPUT="Kanban-PT-10000"
export BK_EXAMINATION="Liveness"
export BK_TOOL="tapaal"
export BK_RESULT_DIR="/tmp/BK_RESULTS/OUTPUTS"
export BK_TIME_CONFINEMENT="1800"
export BK_MEMORY_CONFINEMENT="16384"
export BK_BIN_PATH="/home/mcc/BenchKit/bin/"
# this is specific to your benchmark or test
export BIN_DIR="$HOME/BenchKit/bin"
# remove the execution directoty if it exists (to avoid increse of .vmdk images)
if [ -d execution ] ; then
rm -rf execution
fi
# this is for BenchKit: explicit launching of the test
echo "====================================================================="
echo " Generated by BenchKit 2-4028"
echo " Executing tool tapaal"
echo " Input is Kanban-PT-10000, examination is Liveness"
echo " Time confinement is $BK_TIME_CONFINEMENT seconds"
echo " Memory confinement is 16384 MBytes"
echo " Number of cores is 4"
echo " Run identifier is r136-tall-165271825000199"
echo "====================================================================="
echo
echo "--------------------"
echo "preparation of the directory to be used:"
tar xzf /home/mcc/BenchKit/INPUTS/Kanban-PT-10000.tgz
mv Kanban-PT-10000 execution
cd execution
if [ "Liveness" = "ReachabilityDeadlock" ] || [ "Liveness" = "UpperBounds" ] || [ "Liveness" = "QuasiLiveness" ] || [ "Liveness" = "StableMarking" ] || [ "Liveness" = "Liveness" ] || [ "Liveness" = "OneSafe" ] || [ "Liveness" = "StateSpace" ]; then
rm -f GenericPropertiesVerdict.xml
fi
pwd
ls -lh
echo
echo "--------------------"
echo "content from stdout:"
echo
echo "=== Data for post analysis generated by BenchKit (invocation template)"
echo
if [ "Liveness" = "UpperBounds" ] ; then
echo "The expected result is a vector of positive values"
echo NUM_VECTOR
elif [ "Liveness" != "StateSpace" ] ; then
echo "The expected result is a vector of booleans"
echo BOOL_VECTOR
else
echo "no data necessary for post analysis"
fi
echo
if [ -f "Liveness.txt" ] ; then
echo "here is the order used to build the result vector(from text file)"
for x in $(grep Property Liveness.txt | cut -d ' ' -f 2 | sort -u) ; do
echo "FORMULA_NAME $x"
done
elif [ -f "Liveness.xml" ] ; then # for cunf (txt files deleted;-)
echo echo "here is the order used to build the result vector(from xml file)"
for x in $(grep '
echo "FORMULA_NAME $x"
done
elif [ "Liveness" = "ReachabilityDeadlock" ] || [ "Liveness" = "QuasiLiveness" ] || [ "Liveness" = "StableMarking" ] || [ "Liveness" = "Liveness" ] || [ "Liveness" = "OneSafe" ] ; then
echo "FORMULA_NAME Liveness"
fi
echo
echo "=== Now, execution of the tool begins"
echo
echo -n "BK_START "
date -u +%s%3N
echo
timeout -s 9 $BK_TIME_CONFINEMENT bash -c "/home/mcc/BenchKit/BenchKit_head.sh 2> STDERR ; echo ; echo -n \"BK_STOP \" ; date -u +%s%3N"
if [ $? -eq 137 ] ; then
echo
echo "BK_TIME_CONFINEMENT_REACHED"
fi
echo
echo "--------------------"
echo "content from stderr:"
echo
cat STDERR ;