

About the Execution of Tapaal for BART-COL-060
| Execution Summary | |||||
| Max Memory Used (MB) |
Time wait (ms) | CPU Usage (ms) | I/O Wait (ms) | Computed Result | Execution Status |
| 16225.651 | 3591873.00 | 8023512.00 | 8427.90 | TFTFTTTFTTFTTF?F | normal |
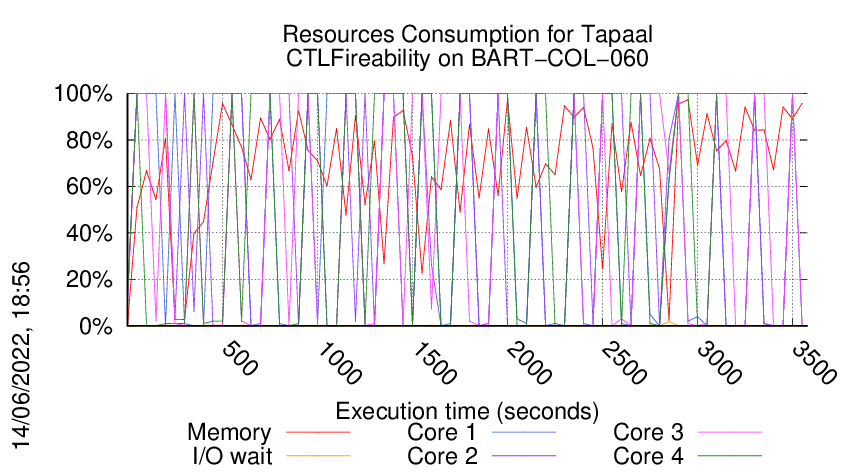
Execution Chart
We display below the execution chart for this examination (boot time has been removed).
Trace from the execution
Formatting '/mnt/tpsp/fkordon/mcc2022-input.r003-tajo-165245683200586.qcow2', fmt=qcow2 size=4294967296 backing_file='/mnt/tpsp/fkordon/mcc2022-input.qcow2' encryption=off cluster_size=65536 lazy_refcounts=off
Waiting for the VM to be ready (probing ssh)
......................
=====================================================================
Generated by BenchKit 2-4028
Executing tool tapaal
Input is BART-COL-060, examination is CTLFireability
Time confinement is 3600 seconds
Memory confinement is 16384 MBytes
Number of cores is 4
Run identifier is r003-tajo-165245683200586
=====================================================================
--------------------
preparation of the directory to be used:
/home/mcc/execution
total 432K
-rw-r--r-- 1 mcc users 5.5K Apr 29 22:06 CTLCardinality.txt
-rw-r--r-- 1 mcc users 46K Apr 29 22:06 CTLCardinality.xml
-rw-r--r-- 1 mcc users 5.7K Apr 29 21:04 CTLFireability.txt
-rw-r--r-- 1 mcc users 47K Apr 29 21:04 CTLFireability.xml
-rw-r--r-- 1 mcc users 5 May 10 09:33 equiv_pt
-rw-r--r-- 1 mcc users 4.2K May 10 09:33 GenericPropertiesDefinition.xml
-rw-r--r-- 1 mcc users 6.4K May 10 09:33 GenericPropertiesVerdict.xml
-rw-r--r-- 1 mcc users 4 May 10 09:33 instance
-rw-r--r-- 1 mcc users 5 May 10 09:33 iscolored
-rw-r--r-- 1 mcc users 4.5K May 9 07:06 LTLCardinality.txt
-rw-r--r-- 1 mcc users 29K May 9 07:06 LTLCardinality.xml
-rw-r--r-- 1 mcc users 2.4K May 9 07:06 LTLFireability.txt
-rw-r--r-- 1 mcc users 17K May 9 07:06 LTLFireability.xml
-rw-r--r-- 1 mcc users 219K May 10 09:33 model.pnml
-rw-r--r-- 1 mcc users 1.6K May 9 07:06 UpperBounds.txt
-rw-r--r-- 1 mcc users 3.7K May 9 07:06 UpperBounds.xml
--------------------
content from stdout:
=== Data for post analysis generated by BenchKit (invocation template)
The expected result is a vector of booleans
BOOL_VECTOR
here is the order used to build the result vector(from text file)
FORMULA_NAME BART-COL-060-CTLFireability-00
FORMULA_NAME BART-COL-060-CTLFireability-01
FORMULA_NAME BART-COL-060-CTLFireability-02
FORMULA_NAME BART-COL-060-CTLFireability-03
FORMULA_NAME BART-COL-060-CTLFireability-04
FORMULA_NAME BART-COL-060-CTLFireability-05
FORMULA_NAME BART-COL-060-CTLFireability-06
FORMULA_NAME BART-COL-060-CTLFireability-07
FORMULA_NAME BART-COL-060-CTLFireability-08
FORMULA_NAME BART-COL-060-CTLFireability-09
FORMULA_NAME BART-COL-060-CTLFireability-10
FORMULA_NAME BART-COL-060-CTLFireability-11
FORMULA_NAME BART-COL-060-CTLFireability-12
FORMULA_NAME BART-COL-060-CTLFireability-13
FORMULA_NAME BART-COL-060-CTLFireability-14
FORMULA_NAME BART-COL-060-CTLFireability-15
=== Now, execution of the tool begins
BK_START 1652566804969
tapaal
Got BK_BIN_PATH=/home/mcc/BenchKit/bin/
---> tapaal --- TAPAAL v5
Setting MODEL_PATH=.
Setting VERIFYPN=/home/mcc/BenchKit/bin/verifypn
Got BK_TIME_CONFINEMENT=3600
Setting TEMPDIR=/home/mcc/BenchKit/bin/tmp
Got BK_MEMORY_CONFINEMENT=16384
Limiting to 16265216 kB
Total timeout: 3590
Time left: 3589
*************************************
* TAPAAL verifying CTLFireability *
*************************************
TEMPDIR=/home/mcc/BenchKit/bin/tmp
QF=/home/mcc/BenchKit/bin/tmp/tmp.6fIKbDKDZu
MF=/home/mcc/BenchKit/bin/tmp/tmp.OqUTgOXkRe
Time left: 3589
---------------------------------------------------
Step -1: Stripping Colors
---------------------------------------------------
Verifying stripped models (16 in total)
/home/mcc/BenchKit/bin/verifypn -n -c -q 718 -l 29 -d 299 -z 4 -x 1,2,3,4,5,6,7,8,9,10,11,12,13,14,15,16 ./model.pnml ./CTLFireability.xml
Warning: CPN OverApproximation is only available for Reachability queries without deadlock, negated fireability and UpperBounds, skipping BART-COL-060-CTLFireability-15
Warning: CPN OverApproximation is only available for Reachability queries without deadlock, negated fireability and UpperBounds, skipping BART-COL-060-CTLFireability-14
Warning: CPN OverApproximation is only available for Reachability queries without deadlock, negated fireability and UpperBounds, skipping BART-COL-060-CTLFireability-13
Warning: CPN OverApproximation is only available for Reachability queries without deadlock, negated fireability and UpperBounds, skipping BART-COL-060-CTLFireability-12
Warning: CPN OverApproximation is only available for Reachability queries without deadlock, negated fireability and UpperBounds, skipping BART-COL-060-CTLFireability-11
Warning: CPN OverApproximation is only available for Reachability queries without deadlock, negated fireability and UpperBounds, skipping BART-COL-060-CTLFireability-10
Warning: CPN OverApproximation is only available for Reachability queries without deadlock, negated fireability and UpperBounds, skipping BART-COL-060-CTLFireability-09
Warning: CPN OverApproximation is only available for Reachability queries without deadlock, negated fireability and UpperBounds, skipping BART-COL-060-CTLFireability-08
Warning: CPN OverApproximation is only available for Reachability queries without deadlock, negated fireability and UpperBounds, skipping BART-COL-060-CTLFireability-07
Warning: CPN OverApproximation is only available for Reachability queries without deadlock, negated fireability and UpperBounds, skipping BART-COL-060-CTLFireability-06
Warning: CPN OverApproximation is only available for Reachability queries without deadlock, negated fireability and UpperBounds, skipping BART-COL-060-CTLFireability-05
Warning: CPN OverApproximation is only available for Reachability queries without deadlock, negated fireability and UpperBounds, skipping BART-COL-060-CTLFireability-04
Warning: CPN OverApproximation is only available for Reachability queries without deadlock, negated fireability and UpperBounds, skipping BART-COL-060-CTLFireability-03
Warning: CPN OverApproximation is only available for Reachability queries without deadlock, negated fireability and UpperBounds, skipping BART-COL-060-CTLFireability-02
Warning: CPN OverApproximation is only available for Reachability queries without deadlock, negated fireability and UpperBounds, skipping BART-COL-060-CTLFireability-01
Warning: CPN OverApproximation is only available for Reachability queries without deadlock, negated fireability and UpperBounds, skipping BART-COL-060-CTLFireability-00
WARNING: Could not run CPN over-approximation on any queries, terminating.
Time left: 3589
---------------------------------------------------
Step 0: Parallel Simplification
---------------------------------------------------
Doing parallel simplification (16 in total)
Total simplification timout is 718 -- reduction timeout is 299
timeout 3589 /home/mcc/BenchKit/bin/verifypn -n -q 718 -l 29 -d 299 -z 4 -s OverApprox --binary-query-io 2 --write-simplified /home/mcc/BenchKit/bin/tmp/tmp.6fIKbDKDZu --write-reduced /home/mcc/BenchKit/bin/tmp/tmp.OqUTgOXkRe -x 1,2,3,4,5,6,7,8,9,10,11,12,13,14,15,16 ./model.pnml ./CTLFireability.xml
Time left: 3587
---------------------------------------------------
Step 1: Parallel processing
---------------------------------------------------
Doing parallel verification of individual queries (16 in total)
Each query is verified by 4 parallel strategies for 299 seconds
------------------- QUERY 1 ----------------------
Solution found by parallel processing (step 1)
Query index 0 was solved
Query is satisfied.
Spent 0.085837 on verification
@@@0.24,59820@@@
parallel: This job succeeded:
eval /usr/bin/time -f "@@@%e,%M@@@" /home/mcc/BenchKit/bin/verifypn -n -s\ BFS\ -q\ 0\ -l\ 0\ -d\ 119 /home/mcc/BenchKit/bin/tmp/tmp.OqUTgOXkRe /home/mcc/BenchKit/bin/tmp/tmp.6fIKbDKDZu --binary-query-io 1 -x 1 -n
FORMULA BART-COL-060-CTLFireability-02 TRUE TECHNIQUES COLLATERAL_PROCESSING EXPLICIT STATE_COMPRESSION SAT_SMT STUBBORN_SETS CTL_CZERO
Time left: 3586
------------------- QUERY 2 ----------------------
Solution found by parallel processing (step 1)
Query index 0 was solved
Query is NOT satisfied.
Spent 0.212295 on verification
@@@0.24,149324@@@
parallel: This job succeeded:
eval /usr/bin/time -f "@@@%e,%M@@@" /home/mcc/BenchKit/bin/verifypn -n -s\ BestFS\ -q\ 0\ -l\ 0\ -d\ 119 /home/mcc/BenchKit/bin/tmp/tmp.OqUTgOXkRe /home/mcc/BenchKit/bin/tmp/tmp.6fIKbDKDZu --binary-query-io 1 -x 2 -n
FORMULA BART-COL-060-CTLFireability-01 FALSE TECHNIQUES COLLATERAL_PROCESSING EXPLICIT STATE_COMPRESSION SAT_SMT STUBBORN_SETS CTL_CZERO
Time left: 3586
------------------- QUERY 3 ----------------------
Solution found by parallel processing (step 1)
Query index 0 was solved
Query is satisfied.
Spent 0.118715 on verification
@@@0.15,59840@@@
parallel: This job succeeded:
eval /usr/bin/time -f "@@@%e,%M@@@" /home/mcc/BenchKit/bin/verifypn -n -tar\ -s\ RDFS\ -q\ 0\ -l\ 0\ -d\ 119 /home/mcc/BenchKit/bin/tmp/tmp.OqUTgOXkRe /home/mcc/BenchKit/bin/tmp/tmp.6fIKbDKDZu --binary-query-io 1 -x 3 -n
FORMULA BART-COL-060-CTLFireability-04 TRUE TECHNIQUES COLLATERAL_PROCESSING EXPLICIT STATE_COMPRESSION SAT_SMT STUBBORN_SETS CTL_CZERO
Time left: 3585
------------------- QUERY 4 ----------------------
Solution found by parallel processing (step 1)
Query index 0 was solved
Query is NOT satisfied.
Spent 0.118676 on verification
@@@0.16,59808@@@
parallel: This job succeeded:
eval /usr/bin/time -f "@@@%e,%M@@@" /home/mcc/BenchKit/bin/verifypn -n -tar\ -s\ RDFS\ -q\ 0\ -l\ 0\ -d\ 119 /home/mcc/BenchKit/bin/tmp/tmp.OqUTgOXkRe /home/mcc/BenchKit/bin/tmp/tmp.6fIKbDKDZu --binary-query-io 1 -x 4 -n
FORMULA BART-COL-060-CTLFireability-15 FALSE TECHNIQUES COLLATERAL_PROCESSING EXPLICIT STATE_COMPRESSION SAT_SMT STUBBORN_SETS CTL_CZERO
Time left: 3585
------------------- QUERY 5 ----------------------
Solution found by parallel processing (step 1)
Query index 0 was solved
Query is satisfied.
Spent 0.175678 on verification
@@@0.19,60968@@@
parallel: This job succeeded:
eval /usr/bin/time -f "@@@%e,%M@@@" /home/mcc/BenchKit/bin/verifypn -n -tar\ -s\ RDFS\ -q\ 0\ -l\ 0\ -d\ 119 /home/mcc/BenchKit/bin/tmp/tmp.OqUTgOXkRe /home/mcc/BenchKit/bin/tmp/tmp.6fIKbDKDZu --binary-query-io 1 -x 5 -n
FORMULA BART-COL-060-CTLFireability-06 TRUE TECHNIQUES COLLATERAL_PROCESSING EXPLICIT STATE_COMPRESSION SAT_SMT STUBBORN_SETS CTL_CZERO
Time left: 3584
------------------- QUERY 6 ----------------------
Solution found by parallel processing (step 1)
Query index 0 was solved
Query is NOT satisfied.
Spent 0.078642 on verification
@@@0.14,59724@@@
Query index 0 was solved
Query is NOT satisfied.
Spent 0.119124 on verification
@@@0.14,59896@@@
parallel: This job succeeded:
eval /usr/bin/time -f "@@@%e,%M@@@" /home/mcc/BenchKit/bin/verifypn -n -s\ BFS\ -q\ 0\ -l\ 0\ -d\ 119 /home/mcc/BenchKit/bin/tmp/tmp.OqUTgOXkRe /home/mcc/BenchKit/bin/tmp/tmp.6fIKbDKDZu --binary-query-io 1 -x 6 -n
parallel: This job succeeded:
eval /usr/bin/time -f "@@@%e,%M@@@" /home/mcc/BenchKit/bin/verifypn -n -s\ DFS\ -q\ 0\ -l\ 0\ -d\ 119 /home/mcc/BenchKit/bin/tmp/tmp.OqUTgOXkRe /home/mcc/BenchKit/bin/tmp/tmp.6fIKbDKDZu --binary-query-io 1 -x 6 -n
FORMULA BART-COL-060-CTLFireability-10 FALSE TECHNIQUES COLLATERAL_PROCESSING EXPLICIT STATE_COMPRESSION SAT_SMT STUBBORN_SETS CTL_CZERO
Time left: 3584
------------------- QUERY 7 ----------------------
Solution found by parallel processing (step 1)
Query index 0 was solved
Query is satisfied.
Spent 0.076258 on verification
@@@0.11,60108@@@
parallel: This job succeeded:
eval /usr/bin/time -f "@@@%e,%M@@@" /home/mcc/BenchKit/bin/verifypn -n -s\ DFS\ -q\ 0\ -l\ 0\ -d\ 119 /home/mcc/BenchKit/bin/tmp/tmp.OqUTgOXkRe /home/mcc/BenchKit/bin/tmp/tmp.6fIKbDKDZu --binary-query-io 1 -x 7 -n
FORMULA BART-COL-060-CTLFireability-00 TRUE TECHNIQUES COLLATERAL_PROCESSING EXPLICIT STATE_COMPRESSION SAT_SMT STUBBORN_SETS CTL_CZERO
Time left: 3583
------------------- QUERY 8 ----------------------
Solution found by parallel processing (step 1)
Query index 0 was solved
Query is satisfied.
Spent 0.10448 on verification
@@@0.10,59828@@@
parallel: This job succeeded:
eval /usr/bin/time -f "@@@%e,%M@@@" /home/mcc/BenchKit/bin/verifypn -n -tar\ -s\ RDFS\ -q\ 0\ -l\ 0\ -d\ 119 /home/mcc/BenchKit/bin/tmp/tmp.OqUTgOXkRe /home/mcc/BenchKit/bin/tmp/tmp.6fIKbDKDZu --binary-query-io 1 -x 8 -n
FORMULA BART-COL-060-CTLFireability-05 TRUE TECHNIQUES COLLATERAL_PROCESSING EXPLICIT STATE_COMPRESSION SAT_SMT STUBBORN_SETS CTL_CZERO
Time left: 3583
------------------- QUERY 9 ----------------------
Solution found by parallel processing (step 1)
Query index 0 was solved
Query is satisfied.
Spent 0.070197 on verification
@@@0.08,59972@@@
parallel: This job succeeded:
eval /usr/bin/time -f "@@@%e,%M@@@" /home/mcc/BenchKit/bin/verifypn -n -s\ BestFS\ -q\ 0\ -l\ 0\ -d\ 119 /home/mcc/BenchKit/bin/tmp/tmp.OqUTgOXkRe /home/mcc/BenchKit/bin/tmp/tmp.6fIKbDKDZu --binary-query-io 1 -x 9 -n
FORMULA BART-COL-060-CTLFireability-08 TRUE TECHNIQUES COLLATERAL_PROCESSING EXPLICIT STATE_COMPRESSION SAT_SMT STUBBORN_SETS CTL_CZERO
Time left: 3583
------------------- QUERY 10 ----------------------
Solution found by parallel processing (step 1)
Query index 0 was solved
Query is satisfied.
Spent 0.068783 on verification
@@@0.08,59912@@@
parallel: This job succeeded:
eval /usr/bin/time -f "@@@%e,%M@@@" /home/mcc/BenchKit/bin/verifypn -n -s\ BestFS\ -q\ 0\ -l\ 0\ -d\ 119 /home/mcc/BenchKit/bin/tmp/tmp.OqUTgOXkRe /home/mcc/BenchKit/bin/tmp/tmp.6fIKbDKDZu --binary-query-io 1 -x 10 -n
FORMULA BART-COL-060-CTLFireability-12 TRUE TECHNIQUES COLLATERAL_PROCESSING EXPLICIT STATE_COMPRESSION SAT_SMT STUBBORN_SETS CTL_CZERO
Time left: 3582
------------------- QUERY 11 ----------------------
Solution found by parallel processing (step 1)
Query index 0 was solved
Query is satisfied.
Spent 0.075234 on verification
@@@0.08,59852@@@
parallel: This job succeeded:
eval /usr/bin/time -f "@@@%e,%M@@@" /home/mcc/BenchKit/bin/verifypn -n -s\ BestFS\ -q\ 0\ -l\ 0\ -d\ 119 /home/mcc/BenchKit/bin/tmp/tmp.OqUTgOXkRe /home/mcc/BenchKit/bin/tmp/tmp.6fIKbDKDZu --binary-query-io 1 -x 11 -n
FORMULA BART-COL-060-CTLFireability-09 TRUE TECHNIQUES COLLATERAL_PROCESSING EXPLICIT STATE_COMPRESSION SAT_SMT STUBBORN_SETS CTL_CZERO
Time left: 3582
------------------- QUERY 12 ----------------------
Solution found by parallel processing (step 1)
Query index 0 was solved
Query is NOT satisfied.
Spent 0.072463 on verification
@@@0.08,59872@@@
parallel: This job succeeded:
eval /usr/bin/time -f "@@@%e,%M@@@" /home/mcc/BenchKit/bin/verifypn -n -tar\ -s\ RDFS\ -q\ 0\ -l\ 0\ -d\ 119 /home/mcc/BenchKit/bin/tmp/tmp.OqUTgOXkRe /home/mcc/BenchKit/bin/tmp/tmp.6fIKbDKDZu --binary-query-io 1 -x 12 -n
FORMULA BART-COL-060-CTLFireability-07 FALSE TECHNIQUES COLLATERAL_PROCESSING EXPLICIT STATE_COMPRESSION SAT_SMT STUBBORN_SETS CTL_CZERO
Time left: 3582
------------------- QUERY 13 ----------------------
No solution found
Command terminated by signal 9
@@@88.43,5836116@@@
Command terminated by signal 9
@@@127.53,8206948@@@
terminate called after throwing an instance of 'std::bad_alloc'
what(): std::bad_alloc
Command terminated by signal 6
@@@234.09,15765584@@@
Time left: 3281
------------------- QUERY 14 ----------------------
Solution found by parallel processing (step 1)
Query index 0 was solved
Query is NOT satisfied.
Spent 0.085022 on verification
Query index 0 was solved
Query is NOT satisfied.
Spent 0.099695 on verification
@@@0.15,59936@@@
@@@0.16,59756@@@
parallel: This job succeeded:
eval /usr/bin/time -f "@@@%e,%M@@@" /home/mcc/BenchKit/bin/verifypn -n -s\ BFS\ -q\ 0\ -l\ 0\ -d\ 119 /home/mcc/BenchKit/bin/tmp/tmp.OqUTgOXkRe /home/mcc/BenchKit/bin/tmp/tmp.6fIKbDKDZu --binary-query-io 1 -x 14 -n
FORMULA BART-COL-060-CTLFireability-13 FALSE TECHNIQUES COLLATERAL_PROCESSING EXPLICIT STATE_COMPRESSION SAT_SMT STUBBORN_SETS CTL_CZERO
Time left: 3280
------------------- QUERY 15 ----------------------
Solution found by parallel processing (step 1)
Query index 0 was solved
Query is satisfied.
Spent 0.078616 on verification
@@@0.09,59932@@@
parallel: This job succeeded:
eval /usr/bin/time -f "@@@%e,%M@@@" /home/mcc/BenchKit/bin/verifypn -n -s\ DFS\ -q\ 0\ -l\ 0\ -d\ 119 /home/mcc/BenchKit/bin/tmp/tmp.OqUTgOXkRe /home/mcc/BenchKit/bin/tmp/tmp.6fIKbDKDZu --binary-query-io 1 -x 15 -n
FORMULA BART-COL-060-CTLFireability-11 TRUE TECHNIQUES COLLATERAL_PROCESSING EXPLICIT STATE_COMPRESSION SAT_SMT STUBBORN_SETS CTL_CZERO
Time left: 3280
------------------- QUERY 16 ----------------------
Solution found by parallel processing (step 1)
Query index 0 was solved
Query is NOT satisfied.
Spent 0.099228 on verification
@@@0.12,59860@@@
parallel: This job succeeded:
eval /usr/bin/time -f "@@@%e,%M@@@" /home/mcc/BenchKit/bin/verifypn -n -s\ BestFS\ -q\ 0\ -l\ 0\ -d\ 119 /home/mcc/BenchKit/bin/tmp/tmp.OqUTgOXkRe /home/mcc/BenchKit/bin/tmp/tmp.6fIKbDKDZu --binary-query-io 1 -x 16 -n
FORMULA BART-COL-060-CTLFireability-03 FALSE TECHNIQUES COLLATERAL_PROCESSING EXPLICIT STATE_COMPRESSION SAT_SMT STUBBORN_SETS CTL_CZERO
Time left: 3279
---------------------------------------------------
Step 2: Sequential processing
---------------------------------------------------
Remaining 1 queries are verified sequentially.
Each query is verified for a dynamic timeout (at least 598 seconds)
Time left: 3279
------------------- QUERY 13 ----------------------
Running query 13 for 3279 seconds. Remaining: 1 queries and 3279 seconds
No solution found
Command terminated by signal 9
@@@88.50,9009584@@@
terminate called after throwing an instance of 'std::bad_alloc'
what(): std::bad_alloc
Command terminated by signal 6
@@@192.08,15766192@@@
Time left: 3087
Time left: 3087
---------------------------------------------------
Step 4: Random Parallel processing
---------------------------------------------------
Doing random parallel verification of individual queries (1 in total)
Each query is verified by 4 parallel strategies for 3087 seconds
------------------- QUERY 13 ----------------------
No solution found
Command terminated by signal 9
@@@57.20,5367136@@@
Command terminated by signal 9
@@@78.19,7145964@@@
Command terminated by signal 9
@@@119.82,8270468@@@
terminate called after throwing an instance of 'std::bad_alloc'
what(): std::bad_alloc
Command terminated by signal 6
@@@212.84,15767864@@@
Time left: 2874
Time left: 2874
---------------------------------------------------
Step 4: Random Parallel processing
---------------------------------------------------
Doing random parallel verification of individual queries (1 in total)
Each query is verified by 4 parallel strategies for 2874 seconds
------------------- QUERY 13 ----------------------
No solution found
Command terminated by signal 9
@@@43.76,4357608@@@
Command terminated by signal 9
@@@65.54,5753768@@@
Command terminated by signal 9
@@@99.64,8478468@@@
terminate called after throwing an instance of 'std::bad_alloc'
what(): std::bad_alloc
Command terminated by signal 6
@@@197.13,15767956@@@
Time left: 2676
Time left: 2676
---------------------------------------------------
Step 4: Random Parallel processing
---------------------------------------------------
Doing random parallel verification of individual queries (1 in total)
Each query is verified by 4 parallel strategies for 2676 seconds
------------------- QUERY 13 ----------------------
No solution found
Command terminated by signal 9
@@@56.25,5138836@@@
Command terminated by signal 9
@@@89.48,5459008@@@
Command terminated by signal 9
@@@123.85,8192508@@@
terminate called after throwing an instance of 'std::bad_alloc'
what(): std::bad_alloc
Command terminated by signal 6
@@@218.37,15767744@@@
Time left: 2457
Time left: 2457
---------------------------------------------------
Step 4: Random Parallel processing
---------------------------------------------------
Doing random parallel verification of individual queries (1 in total)
Each query is verified by 4 parallel strategies for 2457 seconds
------------------- QUERY 13 ----------------------
No solution found
Command terminated by signal 9
@@@58.46,4879144@@@
Command terminated by signal 9
@@@84.19,5770612@@@
Command terminated by signal 9
@@@115.89,8574108@@@
terminate called after throwing an instance of 'std::bad_alloc'
what(): std::bad_alloc
Command terminated by signal 6
@@@207.44,15767748@@@
Time left: 2249
Time left: 2249
---------------------------------------------------
Step 4: Random Parallel processing
---------------------------------------------------
Doing random parallel verification of individual queries (1 in total)
Each query is verified by 4 parallel strategies for 2249 seconds
------------------- QUERY 13 ----------------------
No solution found
Command terminated by signal 9
@@@77.10,4193044@@@
Command terminated by signal 9
@@@92.52,5500320@@@
Command terminated by signal 9
@@@125.44,8573680@@@
terminate called after throwing an instance of 'std::bad_alloc'
what(): std::bad_alloc
Command terminated by signal 6
@@@208.62,15769908@@@
Time left: 2041
Time left: 2041
---------------------------------------------------
Step 4: Random Parallel processing
---------------------------------------------------
Doing random parallel verification of individual queries (1 in total)
Each query is verified by 4 parallel strategies for 2041 seconds
------------------- QUERY 13 ----------------------
No solution found
Command terminated by signal 9
@@@43.07,4309936@@@
Command terminated by signal 9
@@@59.36,5837076@@@
Command terminated by signal 9
@@@94.70,8309924@@@
terminate called after throwing an instance of 'std::bad_alloc'
what(): std::bad_alloc
Command terminated by signal 6
@@@176.96,15767800@@@
Time left: 1863
Time left: 1863
---------------------------------------------------
Step 4: Random Parallel processing
---------------------------------------------------
Doing random parallel verification of individual queries (1 in total)
Each query is verified by 4 parallel strategies for 1863 seconds
------------------- QUERY 13 ----------------------
No solution found
Command terminated by signal 9
@@@76.60,4146488@@@
Command terminated by signal 9
@@@94.12,5706152@@@
Command terminated by signal 9
@@@126.57,8166496@@@
terminate called after throwing an instance of 'std::bad_alloc'
what(): std::bad_alloc
Command terminated by signal 6
@@@207.25,15767968@@@
Time left: 1656
Time left: 1656
---------------------------------------------------
Step 4: Random Parallel processing
---------------------------------------------------
Doing random parallel verification of individual queries (1 in total)
Each query is verified by 4 parallel strategies for 1656 seconds
------------------- QUERY 13 ----------------------
No solution found
Command terminated by signal 9
@@@53.37,5689576@@@
Command terminated by signal 9
@@@81.36,7291208@@@
Command terminated by signal 9
@@@120.16,8150520@@@
terminate called after throwing an instance of 'std::bad_alloc'
what(): std::bad_alloc
Command terminated by signal 6
@@@198.17,15767868@@@
Time left: 1457
Time left: 1457
---------------------------------------------------
Step 4: Random Parallel processing
---------------------------------------------------
Doing random parallel verification of individual queries (1 in total)
Each query is verified by 4 parallel strategies for 1457 seconds
------------------- QUERY 13 ----------------------
No solution found
Command terminated by signal 9
@@@52.95,4643084@@@
Command terminated by signal 9
@@@76.26,5627392@@@
Command terminated by signal 9
@@@104.85,8172920@@@
terminate called after throwing an instance of 'std::bad_alloc'
what(): std::bad_alloc
Command terminated by signal 6
@@@184.04,15767908@@@
Time left: 1273
Time left: 1273
---------------------------------------------------
Step 4: Random Parallel processing
---------------------------------------------------
Doing random parallel verification of individual queries (1 in total)
Each query is verified by 4 parallel strategies for 1273 seconds
------------------- QUERY 13 ----------------------
No solution found
Command terminated by signal 9
@@@51.75,4614392@@@
Command terminated by signal 9
@@@68.14,5873868@@@
Command terminated by signal 9
@@@101.53,8141404@@@
terminate called after throwing an instance of 'std::bad_alloc'
what(): std::bad_alloc
Command terminated by signal 6
@@@181.69,15767808@@@
Time left: 1091
Time left: 1091
---------------------------------------------------
Step 4: Random Parallel processing
---------------------------------------------------
Doing random parallel verification of individual queries (1 in total)
Each query is verified by 4 parallel strategies for 1091 seconds
------------------- QUERY 13 ----------------------
No solution found
Command terminated by signal 9
@@@55.37,4581720@@@
Command terminated by signal 9
@@@71.76,5665320@@@
Command terminated by signal 9
@@@101.40,8074732@@@
terminate called after throwing an instance of 'std::bad_alloc'
what(): std::bad_alloc
Command terminated by signal 6
@@@180.40,15767996@@@
Time left: 910
Time left: 910
---------------------------------------------------
Step 4: Random Parallel processing
---------------------------------------------------
Doing random parallel verification of individual queries (1 in total)
Each query is verified by 4 parallel strategies for 910 seconds
------------------- QUERY 13 ----------------------
No solution found
Command terminated by signal 9
@@@53.95,4367612@@@
Command terminated by signal 9
@@@69.41,5687140@@@
Command terminated by signal 9
@@@101.99,8420804@@@
terminate called after throwing an instance of 'std::bad_alloc'
what(): std::bad_alloc
Command terminated by signal 6
@@@183.42,15767724@@@
Time left: 726
Time left: 726
---------------------------------------------------
Step 4: Random Parallel processing
---------------------------------------------------
Doing random parallel verification of individual queries (1 in total)
Each query is verified by 4 parallel strategies for 726 seconds
------------------- QUERY 13 ----------------------
No solution found
Command terminated by signal 9
@@@52.48,4511152@@@
Command terminated by signal 9
@@@69.50,5911060@@@
Command terminated by signal 9
@@@102.59,8488456@@@
terminate called after throwing an instance of 'std::bad_alloc'
what(): std::bad_alloc
Command terminated by signal 6
@@@212.15,15767960@@@
Time left: 514
Time left: 514
---------------------------------------------------
Step 4: Random Parallel processing
---------------------------------------------------
Doing random parallel verification of individual queries (1 in total)
Each query is verified by 4 parallel strategies for 514 seconds
------------------- QUERY 13 ----------------------
No solution found
Command terminated by signal 9
@@@52.37,4861380@@@
Command terminated by signal 9
@@@72.98,6022460@@@
Command terminated by signal 9
@@@105.16,8278988@@@
terminate called after throwing an instance of 'std::bad_alloc'
what(): std::bad_alloc
Command terminated by signal 6
@@@193.11,15769980@@@
Time left: 320
Time left: 320
---------------------------------------------------
Step 4: Random Parallel processing
---------------------------------------------------
Doing random parallel verification of individual queries (1 in total)
Each query is verified by 4 parallel strategies for 320 seconds
------------------- QUERY 13 ----------------------
No solution found
Command terminated by signal 9
@@@53.52,4898928@@@
Command terminated by signal 9
@@@74.06,5940024@@@
Command terminated by signal 9
@@@109.42,8537744@@@
terminate called after throwing an instance of 'std::bad_alloc'
what(): std::bad_alloc
Command terminated by signal 6
@@@199.70,15769736@@@
Time left: 120
Time left: 120
---------------------------------------------------
Step 4: Random Parallel processing
---------------------------------------------------
Doing random parallel verification of individual queries (1 in total)
Each query is verified by 4 parallel strategies for 120 seconds
------------------- QUERY 13 ----------------------
No solution found
Command terminated by signal 9
@@@50.84,4480020@@@
Command terminated by signal 9
@@@67.11,5451372@@@
Command terminated by signal 9
@@@98.64,8377408@@@
Time left: -2
Out of time, terminating!
terminated-with-cleanup
BK_STOP 1652570396842
--------------------
content from stderr:
Sequence of Actions to be Executed by the VM
This is useful if one wants to reexecute the tool in the VM from the submitted image disk.
set -x
# this is for BenchKit: configuration of major elements for the test
export BK_INPUT="BART-COL-060"
export BK_EXAMINATION="CTLFireability"
export BK_TOOL="tapaal"
export BK_RESULT_DIR="/tmp/BK_RESULTS/OUTPUTS"
export BK_TIME_CONFINEMENT="3600"
export BK_MEMORY_CONFINEMENT="16384"
export BK_BIN_PATH="/home/mcc/BenchKit/bin/"
# this is specific to your benchmark or test
export BIN_DIR="$HOME/BenchKit/bin"
# remove the execution directoty if it exists (to avoid increse of .vmdk images)
if [ -d execution ] ; then
rm -rf execution
fi
# this is for BenchKit: explicit launching of the test
echo "====================================================================="
echo " Generated by BenchKit 2-4028"
echo " Executing tool tapaal"
echo " Input is BART-COL-060, examination is CTLFireability"
echo " Time confinement is $BK_TIME_CONFINEMENT seconds"
echo " Memory confinement is 16384 MBytes"
echo " Number of cores is 4"
echo " Run identifier is r003-tajo-165245683200586"
echo "====================================================================="
echo
echo "--------------------"
echo "preparation of the directory to be used:"
tar xzf /home/mcc/BenchKit/INPUTS/BART-COL-060.tgz
mv BART-COL-060 execution
cd execution
if [ "CTLFireability" = "ReachabilityDeadlock" ] || [ "CTLFireability" = "UpperBounds" ] || [ "CTLFireability" = "QuasiLiveness" ] || [ "CTLFireability" = "StableMarking" ] || [ "CTLFireability" = "Liveness" ] || [ "CTLFireability" = "OneSafe" ] || [ "CTLFireability" = "StateSpace" ]; then
rm -f GenericPropertiesVerdict.xml
fi
pwd
ls -lh
echo
echo "--------------------"
echo "content from stdout:"
echo
echo "=== Data for post analysis generated by BenchKit (invocation template)"
echo
if [ "CTLFireability" = "UpperBounds" ] ; then
echo "The expected result is a vector of positive values"
echo NUM_VECTOR
elif [ "CTLFireability" != "StateSpace" ] ; then
echo "The expected result is a vector of booleans"
echo BOOL_VECTOR
else
echo "no data necessary for post analysis"
fi
echo
if [ -f "CTLFireability.txt" ] ; then
echo "here is the order used to build the result vector(from text file)"
for x in $(grep Property CTLFireability.txt | cut -d ' ' -f 2 | sort -u) ; do
echo "FORMULA_NAME $x"
done
elif [ -f "CTLFireability.xml" ] ; then # for cunf (txt files deleted;-)
echo echo "here is the order used to build the result vector(from xml file)"
for x in $(grep '
echo "FORMULA_NAME $x"
done
elif [ "CTLFireability" = "ReachabilityDeadlock" ] || [ "CTLFireability" = "QuasiLiveness" ] || [ "CTLFireability" = "StableMarking" ] || [ "CTLFireability" = "Liveness" ] || [ "CTLFireability" = "OneSafe" ] ; then
echo "FORMULA_NAME CTLFireability"
fi
echo
echo "=== Now, execution of the tool begins"
echo
echo -n "BK_START "
date -u +%s%3N
echo
timeout -s 9 $BK_TIME_CONFINEMENT bash -c "/home/mcc/BenchKit/BenchKit_head.sh 2> STDERR ; echo ; echo -n \"BK_STOP \" ; date -u +%s%3N"
if [ $? -eq 137 ] ; then
echo
echo "BK_TIME_CONFINEMENT_REACHED"
fi
echo
echo "--------------------"
echo "content from stderr:"
echo
cat STDERR ;