

About the Execution of Tapaal for HypercubeGrid-PT-C4K3P3B12
| Execution Summary | |||||
| Max Memory Used (MB) |
Time wait (ms) | CPU Usage (ms) | I/O Wait (ms) | Computed Result | Execution Status |
| 14316.710 | 3600000.00 | 4382960.00 | 257.60 | ??TTT???FF?F?TF? | normal |
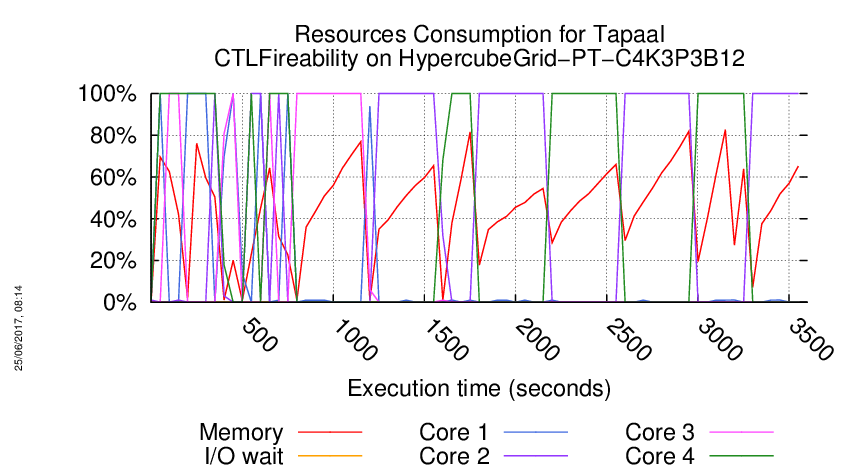
Execution Chart
We display below the execution chart for this examination (boot time has been removed).
Trace from the execution
Waiting for the VM to be ready (probing ssh)
......
=====================================================================
Generated by BenchKit 2-3254
Executing tool tapaal
Input is HypercubeGrid-PT-C4K3P3B12, examination is CTLFireability
Time confinement is 3600 seconds
Memory confinement is 16384 MBytes
Number of cores is 4
Run identifier is r039-blw7-149440485400013
=====================================================================
--------------------
content from stdout:
=== Data for post analysis generated by BenchKit (invocation template)
The expected result is a vector of booleans
BOOL_VECTOR
here is the order used to build the result vector(from text file)
FORMULA_NAME HypercubeGrid-PT-C4K3P3B12-CTLFireability-0
FORMULA_NAME HypercubeGrid-PT-C4K3P3B12-CTLFireability-1
FORMULA_NAME HypercubeGrid-PT-C4K3P3B12-CTLFireability-10
FORMULA_NAME HypercubeGrid-PT-C4K3P3B12-CTLFireability-11
FORMULA_NAME HypercubeGrid-PT-C4K3P3B12-CTLFireability-12
FORMULA_NAME HypercubeGrid-PT-C4K3P3B12-CTLFireability-13
FORMULA_NAME HypercubeGrid-PT-C4K3P3B12-CTLFireability-14
FORMULA_NAME HypercubeGrid-PT-C4K3P3B12-CTLFireability-15
FORMULA_NAME HypercubeGrid-PT-C4K3P3B12-CTLFireability-2
FORMULA_NAME HypercubeGrid-PT-C4K3P3B12-CTLFireability-3
FORMULA_NAME HypercubeGrid-PT-C4K3P3B12-CTLFireability-4
FORMULA_NAME HypercubeGrid-PT-C4K3P3B12-CTLFireability-5
FORMULA_NAME HypercubeGrid-PT-C4K3P3B12-CTLFireability-6
FORMULA_NAME HypercubeGrid-PT-C4K3P3B12-CTLFireability-7
FORMULA_NAME HypercubeGrid-PT-C4K3P3B12-CTLFireability-8
FORMULA_NAME HypercubeGrid-PT-C4K3P3B12-CTLFireability-9
=== Now, execution of the tool begins
BK_START 1494664905251
---> tapaal --- TAPAAL
Total timeout: 3600
*************************************
* TAPAAL verifying CTLFireability *
*************************************
---------------------------------------------------
Step 1: Parallel processing
---------------------------------------------------
Doing parallel verification of individual queries (16 in total)
Each query is verified by 2 parallel strategies for 60 seconds
------------------- QUERY 1 ----------------------
No solution found
Parameters: -s DFS -d 10 ./model.pnml ./CTLFireability.xml -x 1
Parameters: -s DFS -q 0 -d 10 ./model.pnml ./CTLFireability.xml -x 1
------------------- QUERY 2 ----------------------
No solution found
Parameters: -s DFS -d 10 ./model.pnml ./CTLFireability.xml -x 2
Parameters: -s DFS -q 0 -d 10 ./model.pnml ./CTLFireability.xml -x 2
------------------- QUERY 3 ----------------------
Solution found
Parameters: -s DFS -d 10 ./model.pnml ./CTLFireability.xml -x 3
Parameters: -s DFS -q 0 -d 10 ./model.pnml ./CTLFireability.xml -x 3
Search=DFS,Trace=DISABLED,State_Space_Exploration=DISABLED,Structural_Reduction=AGGRESSIVE,Struct_Red_Timout=10,Stubborn_Reduction=ENABLED,Query_Simplication=DISABLED,Siphon_Trap=DISABLED,LPSolve_Timeout=10
Query is NOT satisfied.
STATS:
Time (seconds): 35.85
Configurations: 2567140
Markings: 2560837
Edges: 12729
Processed Edges: 25458
Processed N. Edges: 0
Explored Configs: 12730
Query: A(EX((tokens-count(pb_d3_n2_1_1_3_2) ge integer-constant(1) & tokens-count(pil_d3_n1_1_1_4_2) ge integer-constant(1)) | (tokens-count(pbl_3_2_1_1) ge integer-constant(1) & tokens-count(pi_d4_n1_3_2_1_1) ge integer-constant(1)))) U (((!((tokens-count(pbl_3_1_3_2) ge integer-constant(1) & tokens-count(pi_d2_n1_3_1_3_2) ge integer-constant(1))) & ((tokens-count(pbl_3_2_2_3) ge integer-constant(1) & tokens-count(pi_d1_n1_3_2_2_3) ge integer-constant(1)) & (tokens-count(pbl_1_3_1_1) ge integer-constant(1) & tokens-count(pi_d4_n1_1_3_1_1) ge integer-constant(1)))) | !(!((tokens-count(pbl_3_1_3_2) ge integer-constant(1) & tokens-count(po_d3_n1_3_1_4_2) ge integer-constant(1))))))
parallel: This job succeeded:
/home/mcc/BenchKit/start.sh 14500000 /home/mcc/BenchKit/bin/verifypn-linux64 -s\ DFS\ -q\ 0\ -d\ 10 ./model.pnml ./CTLFireability.xml -x 3
FORMULA HypercubeGrid-PT-C4K3P3B12-CTLFireability-2 FALSE TECHNIQUES COLLATERAL_PROCESSING EXPLICIT STRUCTURAL_REDUCTION STATE_COMPRESSION STUBBORN_SETS
------------------- QUERY 4 ----------------------
Solution found
Parameters: -s DFS -d 10 ./model.pnml ./CTLFireability.xml -x 4
Parameters: -s DFS -q 0 -d 10 ./model.pnml ./CTLFireability.xml -x 4
Search=DFS,Trace=DISABLED,State_Space_Exploration=DISABLED,Structural_Reduction=AGGRESSIVE,Struct_Red_Timout=10,Stubborn_Reduction=ENABLED,Query_Simplication=ENABLED,QSTimeout=30,Siphon_Trap=DISABLED,LPSolve_Timeout=10
Query before reduction: AX AF (not (((pbl_3_2_2_1 >= 1) and (po_d3_n1_3_2_3_1 >= 1)) or ((pbl_3_3_3_2 >= 1) and (pi_d3_n1_3_3_3_2 >= 1))))
Query after reduction: AX AF (((pbl_3_2_2_1 < 1) or (po_d3_n1_3_2_3_1 < 1)) and ((pbl_3_3_3_2 < 1) or (pi_d3_n1_3_3_3_2 < 1)))
Query size reduced from 17 to 17 nodes (0.00 percent reduction).
Query reduction finished after 0.422207 seconds.
Query is NOT satisfied.
STATS:
Time (seconds): 36.23
Configurations: 2620850
Markings: 2620850
Edges: 50815
Processed Edges: 94735
Processed N. Edges: 0
Explored Configs: 50815
Query: AXAF((tokens-count(pbl_3_2_2_1) ls integer-constant(1) | tokens-count(po_d3_n1_3_2_3_1) ls integer-constant(1)) & (tokens-count(pbl_3_3_3_2) ls integer-constant(1) | tokens-count(pi_d3_n1_3_3_3_2) ls integer-constant(1)))
Search=DFS,Trace=DISABLED,State_Space_Exploration=DISABLED,Structural_Reduction=AGGRESSIVE,Struct_Red_Timout=10,Stubborn_Reduction=ENABLED,Query_Simplication=DISABLED,Siphon_Trap=DISABLED,LPSolve_Timeout=10
Query is NOT satisfied.
STATS:
Time (seconds): 36.23
Configurations: 2620850
Markings: 2620850
Edges: 50815
Processed Edges: 94735
Processed N. Edges: 0
Explored Configs: 50815
Query: AXAF!(((tokens-count(pbl_3_2_2_1) ge integer-constant(1) & tokens-count(po_d3_n1_3_2_3_1) ge integer-constant(1)) | (tokens-count(pbl_3_3_3_2) ge integer-constant(1) & tokens-count(pi_d3_n1_3_3_3_2) ge integer-constant(1))))
parallel: This job succeeded:
/home/mcc/BenchKit/start.sh 14500000 /home/mcc/BenchKit/bin/verifypn-linux64 -s\ DFS\ -q\ 0\ -d\ 10 ./model.pnml ./CTLFireability.xml -x 4
FORMULA HypercubeGrid-PT-C4K3P3B12-CTLFireability-3 FALSE TECHNIQUES COLLATERAL_PROCESSING EXPLICIT STRUCTURAL_REDUCTION STATE_COMPRESSION STUBBORN_SETS
------------------- QUERY 5 ----------------------
No solution found
Parameters: -s DFS -d 10 ./model.pnml ./CTLFireability.xml -x 5
Parameters: -s DFS -q 0 -d 10 ./model.pnml ./CTLFireability.xml -x 5
------------------- QUERY 6 ----------------------
Solution found
Parameters: -s DFS -d 10 ./model.pnml ./CTLFireability.xml -x 6
Parameters: -s DFS -q 0 -d 10 ./model.pnml ./CTLFireability.xml -x 6
Search=DFS,Trace=DISABLED,State_Space_Exploration=DISABLED,Structural_Reduction=AGGRESSIVE,Struct_Red_Timout=10,Stubborn_Reduction=ENABLED,Query_Simplication=DISABLED,Siphon_Trap=DISABLED,LPSolve_Timeout=10
Query is NOT satisfied.
STATS:
Time (seconds): 37.23
Configurations: 2544998
Markings: 2538990
Edges: 13746
Processed Edges: 27492
Processed N. Edges: 0
Explored Configs: 13747
Query: A(EX((tokens-count(pb_d3_n1_3_2_1_3) ge integer-constant(1) & tokens-count(pol_d3_n1_3_2_1_3) ge integer-constant(1)) | (tokens-count(pbl_1_1_2_3) ge integer-constant(1) & tokens-count(pi_d3_n1_1_1_2_3) ge integer-constant(1)))) U ((tokens-count(pbl_1_3_2_3) ge integer-constant(1) & tokens-count(pi_d3_n1_1_3_2_3) ge integer-constant(1)))
parallel: This job succeeded:
/home/mcc/BenchKit/start.sh 14500000 /home/mcc/BenchKit/bin/verifypn-linux64 -s\ DFS\ -q\ 0\ -d\ 10 ./model.pnml ./CTLFireability.xml -x 6
FORMULA HypercubeGrid-PT-C4K3P3B12-CTLFireability-5 FALSE TECHNIQUES COLLATERAL_PROCESSING EXPLICIT STRUCTURAL_REDUCTION STATE_COMPRESSION STUBBORN_SETS
------------------- QUERY 7 ----------------------
No solution found
Parameters: -s DFS -d 10 ./model.pnml ./CTLFireability.xml -x 7
Parameters: -s DFS -q 0 -d 10 ./model.pnml ./CTLFireability.xml -x 7
------------------- QUERY 8 ----------------------
Solution found
Parameters: -s DFS -d 10 ./model.pnml ./CTLFireability.xml -x 8
Parameters: -s DFS -q 0 -d 10 ./model.pnml ./CTLFireability.xml -x 8
Search=DFS,Trace=DISABLED,State_Space_Exploration=DISABLED,Structural_Reduction=AGGRESSIVE,Struct_Red_Timout=10,Stubborn_Reduction=ENABLED,Query_Simplication=DISABLED,Siphon_Trap=DISABLED,LPSolve_Timeout=10
Query is satisfied.
STATS:
Time (seconds): 36.01
Configurations: 2579030
Markings: 2579029
Edges: 8979
Processed Edges: 11064
Processed N. Edges: 2
Explored Configs: 8979
Query: !(AF!(!((tokens-count(pbl_1_1_1_1) ge integer-constant(1) & tokens-count(pi_d2_n1_1_1_1_1) ge integer-constant(1)))))
Search=DFS,Trace=DISABLED,State_Space_Exploration=DISABLED,Structural_Reduction=AGGRESSIVE,Struct_Red_Timout=10,Stubborn_Reduction=ENABLED,Query_Simplication=ENABLED,QSTimeout=30,Siphon_Trap=DISABLED,LPSolve_Timeout=10
Query before reduction: EG (not ((pbl_1_1_1_1 >= 1) and (pi_d2_n1_1_1_1_1 >= 1)))
Query after reduction: EG ((pbl_1_1_1_1 < 1) or (pi_d2_n1_1_1_1_1 < 1))
Query size reduced from 8 to 8 nodes (0.00 percent reduction).
Query reduction finished after 0.160259 seconds.
Query is satisfied.
STATS:
Time (seconds): 36.07
Configurations: 2579030
Markings: 2579029
Edges: 8979
Processed Edges: 11064
Processed N. Edges: 2
Explored Configs: 8979
Query: !(AF!((tokens-count(pbl_1_1_1_1) ls integer-constant(1) | tokens-count(pi_d2_n1_1_1_1_1) ls integer-constant(1))))
parallel: This job succeeded:
/home/mcc/BenchKit/start.sh 14500000 /home/mcc/BenchKit/bin/verifypn-linux64 -s\ DFS\ -q\ 0\ -d\ 10 ./model.pnml ./CTLFireability.xml -x 8
FORMULA HypercubeGrid-PT-C4K3P3B12-CTLFireability-7 TRUE TECHNIQUES COLLATERAL_PROCESSING EXPLICIT STRUCTURAL_REDUCTION STATE_COMPRESSION STUBBORN_SETS
------------------- QUERY 9 ----------------------
Solution found
Parameters: -s DFS -d 10 ./model.pnml ./CTLFireability.xml -x 9
Parameters: -s DFS -q 0 -d 10 ./model.pnml ./CTLFireability.xml -x 9
Search=DFS,Trace=DISABLED,State_Space_Exploration=DISABLED,Structural_Reduction=AGGRESSIVE,Struct_Red_Timout=10,Stubborn_Reduction=ENABLED,Query_Simplication=DISABLED,Siphon_Trap=DISABLED,LPSolve_Timeout=10
Query is NOT satisfied.
STATS:
Time (seconds): 37.18
Configurations: 2684184
Markings: 2631925
Edges: 36710
Processed Edges: 52732
Processed N. Edges: 19985
Explored Configs: 30497
Query: AF(E((tokens-count(pbl_1_2_1_2) ge integer-constant(1) & tokens-count(po_d2_n1_1_3_1_2) ge integer-constant(1))) U ((tokens-count(pbl_3_2_1_2) ge integer-constant(1) & tokens-count(po_d4_n1_3_2_1_3) ge integer-constant(1))) & !(AF(tokens-count(pb_d3_n2_2_1_3_2) ge integer-constant(1) & tokens-count(pil_d3_n1_2_1_4_2) ge integer-constant(1))))
parallel: This job succeeded:
/home/mcc/BenchKit/start.sh 14500000 /home/mcc/BenchKit/bin/verifypn-linux64 -s\ DFS\ -q\ 0\ -d\ 10 ./model.pnml ./CTLFireability.xml -x 9
FORMULA HypercubeGrid-PT-C4K3P3B12-CTLFireability-8 FALSE TECHNIQUES COLLATERAL_PROCESSING EXPLICIT STRUCTURAL_REDUCTION STATE_COMPRESSION STUBBORN_SETS
------------------- QUERY 10 ----------------------
No solution found
Parameters: -s DFS -d 10 ./model.pnml ./CTLFireability.xml -x 10
Parameters: -s DFS -q 0 -d 10 ./model.pnml ./CTLFireability.xml -x 10
------------------- QUERY 11 ----------------------
Solution found
Parameters: -s DFS -d 10 ./model.pnml ./CTLFireability.xml -x 11
Parameters: -s DFS -q 0 -d 10 ./model.pnml ./CTLFireability.xml -x 11
Search=DFS,Trace=DISABLED,State_Space_Exploration=DISABLED,Structural_Reduction=AGGRESSIVE,Struct_Red_Timout=10,Stubborn_Reduction=ENABLED,Query_Simplication=ENABLED,QSTimeout=30,Siphon_Trap=DISABLED,LPSolve_Timeout=10
Query before reduction: (not E (((pbl_2_2_3_1 >= 1) and (po_d4_n1_2_2_3_2 >= 1)) U AF ((pbl_2_1_3_1 >= 1) and (pi_d3_n1_2_1_3_1 >= 1))))
Query after reduction: (not E (((pbl_2_2_3_1 >= 1) and (po_d4_n1_2_2_3_2 >= 1)) U AF ((pbl_2_1_3_1 >= 1) and (pi_d3_n1_2_1_3_1 >= 1))))
Query size reduced from 16 to 16 nodes (0.00 percent reduction).
Query reduction finished after 0.469201 seconds.
Query is satisfied.
STATS:
Time (seconds): 35.52
Configurations: 2578598
Markings: 2578596
Edges: 8476
Processed Edges: 10055
Processed N. Edges: 2
Explored Configs: 8476
Query: !(E((tokens-count(pbl_2_2_3_1) ge integer-constant(1) & tokens-count(po_d4_n1_2_2_3_2) ge integer-constant(1))) U (AF(tokens-count(pbl_2_1_3_1) ge integer-constant(1) & tokens-count(pi_d3_n1_2_1_3_1) ge integer-constant(1))))
Search=DFS,Trace=DISABLED,State_Space_Exploration=DISABLED,Structural_Reduction=AGGRESSIVE,Struct_Red_Timout=10,Stubborn_Reduction=ENABLED,Query_Simplication=DISABLED,Siphon_Trap=DISABLED,LPSolve_Timeout=10
Query is satisfied.
STATS:
Time (seconds): 35.63
Configurations: 2578598
Markings: 2578596
Edges: 8476
Processed Edges: 10055
Processed N. Edges: 2
Explored Configs: 8476
Query: !(E((tokens-count(pbl_2_2_3_1) ge integer-constant(1) & tokens-count(po_d4_n1_2_2_3_2) ge integer-constant(1))) U (AF(tokens-count(pbl_2_1_3_1) ge integer-constant(1) & tokens-count(pi_d3_n1_2_1_3_1) ge integer-constant(1))))
parallel: This job succeeded:
/home/mcc/BenchKit/start.sh 14500000 /home/mcc/BenchKit/bin/verifypn-linux64 -s\ DFS\ -q\ 0\ -d\ 10 ./model.pnml ./CTLFireability.xml -x 11
FORMULA HypercubeGrid-PT-C4K3P3B12-CTLFireability-10 TRUE TECHNIQUES COLLATERAL_PROCESSING EXPLICIT STRUCTURAL_REDUCTION STATE_COMPRESSION STUBBORN_SETS
------------------- QUERY 12 ----------------------
Solution found
Parameters: -s DFS -d 10 ./model.pnml ./CTLFireability.xml -x 12
Parameters: -s DFS -q 0 -d 10 ./model.pnml ./CTLFireability.xml -x 12
Search=DFS,Trace=DISABLED,State_Space_Exploration=DISABLED,Structural_Reduction=AGGRESSIVE,Struct_Red_Timout=10,Stubborn_Reduction=ENABLED,Query_Simplication=DISABLED,Siphon_Trap=DISABLED,LPSolve_Timeout=10
Query is satisfied.
STATS:
Time (seconds): 35.6
Configurations: 2582760
Markings: 2582105
Edges: 12311
Processed Edges: 16448
Processed N. Edges: 9
Explored Configs: 11662
Query: !(!(EF!((!(AF!((tokens-count(pbl_1_1_3_3) ge integer-constant(1) & tokens-count(po_d2_n1_1_2_3_3) ge integer-constant(1)))) | AF(tokens-count(pbl_1_3_1_3) ge integer-constant(1) & tokens-count(po_d3_n1_1_3_2_3) ge integer-constant(1))))))
Search=DFS,Trace=DISABLED,State_Space_Exploration=DISABLED,Structural_Reduction=AGGRESSIVE,Struct_Red_Timout=10,Stubborn_Reduction=ENABLED,Query_Simplication=ENABLED,QSTimeout=30,Siphon_Trap=DISABLED,LPSolve_Timeout=10
Query before reduction: (not AG (EG ((pbl_1_1_3_3 >= 1) and (po_d2_n1_1_2_3_3 >= 1)) or AF ((pbl_1_3_1_3 >= 1) and (po_d3_n1_1_3_2_3 >= 1))))
Query after reduction: EF (AF ((pbl_1_1_3_3 < 1) or (po_d2_n1_1_2_3_3 < 1)) and EG ((pbl_1_3_1_3 < 1) or (po_d3_n1_1_3_2_3 < 1)))
Query size reduced from 18 to 18 nodes (0.00 percent reduction).
Query reduction finished after 0.283222 seconds.
Query is satisfied.
STATS:
Time (seconds): 35.58
Configurations: 2582757
Markings: 2582105
Edges: 12307
Processed Edges: 16448
Processed N. Edges: 2
Explored Configs: 11659
Query: EF(AF(tokens-count(pbl_1_1_3_3) ls integer-constant(1) | tokens-count(po_d2_n1_1_2_3_3) ls integer-constant(1)) & !(AF!((tokens-count(pbl_1_3_1_3) ls integer-constant(1) | tokens-count(po_d3_n1_1_3_2_3) ls integer-constant(1)))))
parallel: This job succeeded:
/home/mcc/BenchKit/start.sh 14500000 /home/mcc/BenchKit/bin/verifypn-linux64 -s\ DFS\ -q\ 0\ -d\ 10 ./model.pnml ./CTLFireability.xml -x 12
FORMULA HypercubeGrid-PT-C4K3P3B12-CTLFireability-11 TRUE TECHNIQUES COLLATERAL_PROCESSING EXPLICIT STRUCTURAL_REDUCTION STATE_COMPRESSION STUBBORN_SETS
------------------- QUERY 13 ----------------------
Solution found
Parameters: -s DFS -d 10 ./model.pnml ./CTLFireability.xml -x 13
Parameters: -s DFS -q 0 -d 10 ./model.pnml ./CTLFireability.xml -x 13
Search=DFS,Trace=DISABLED,State_Space_Exploration=DISABLED,Structural_Reduction=AGGRESSIVE,Struct_Red_Timout=10,Stubborn_Reduction=ENABLED,Query_Simplication=DISABLED,Siphon_Trap=DISABLED,LPSolve_Timeout=10
Query is satisfied.
STATS:
Time (seconds): 35.99
Configurations: 2581014
Markings: 2581012
Edges: 7642
Processed Edges: 8386
Processed N. Edges: 2
Explored Configs: 7642
Query: A(((tokens-count(pbl_3_2_3_3) ge integer-constant(1) & tokens-count(pi_d3_n1_3_2_3_3) ge integer-constant(1)) & (tokens-count(pb_d4_n2_1_2_1_2) ge integer-constant(1) & tokens-count(pil_d4_n1_1_2_1_3) ge integer-constant(1)))) U (!(AF!(!((tokens-count(pbl_3_2_2_3) ge integer-constant(1) & tokens-count(po_d4_n1_3_2_2_4) ge integer-constant(1))))))
Search=DFS,Trace=DISABLED,State_Space_Exploration=DISABLED,Structural_Reduction=AGGRESSIVE,Struct_Red_Timout=10,Stubborn_Reduction=ENABLED,Query_Simplication=ENABLED,QSTimeout=30,Siphon_Trap=DISABLED,LPSolve_Timeout=10
Query before reduction: A ((((pbl_3_2_3_3 >= 1) and (pi_d3_n1_3_2_3_3 >= 1)) and ((pb_d4_n2_1_2_1_2 >= 1) and (pil_d4_n1_1_2_1_3 >= 1))) U EG (not ((pbl_3_2_2_3 >= 1) and (po_d4_n1_3_2_2_4 >= 1))))
Query after reduction: A ((((pbl_3_2_3_3 >= 1) and (pi_d3_n1_3_2_3_3 >= 1)) and ((pb_d4_n2_1_2_1_2 >= 1) and (pil_d4_n1_1_2_1_3 >= 1))) U EG ((pbl_3_2_2_3 < 1) or (po_d4_n1_3_2_2_4 < 1)))
Query size reduced from 24 to 24 nodes (0.00 percent reduction).
Query reduction finished after 0.638046 seconds.
Query is satisfied.
STATS:
Time (seconds): 35.75
Configurations: 2581014
Markings: 2581012
Edges: 7642
Processed Edges: 8386
Processed N. Edges: 2
Explored Configs: 7642
Query: A(((tokens-count(pbl_3_2_3_3) ge integer-constant(1) & tokens-count(pi_d3_n1_3_2_3_3) ge integer-constant(1)) & (tokens-count(pb_d4_n2_1_2_1_2) ge integer-constant(1) & tokens-count(pil_d4_n1_1_2_1_3) ge integer-constant(1)))) U (!(AF!((tokens-count(pbl_3_2_2_3) ls integer-constant(1) | tokens-count(po_d4_n1_3_2_2_4) ls integer-constant(1)))))
parallel: This job succeeded:
/home/mcc/BenchKit/start.sh 14500000 /home/mcc/BenchKit/bin/verifypn-linux64 -s\ DFS\ -q\ 0\ -d\ 10 ./model.pnml ./CTLFireability.xml -x 13
FORMULA HypercubeGrid-PT-C4K3P3B12-CTLFireability-12 TRUE TECHNIQUES COLLATERAL_PROCESSING EXPLICIT STRUCTURAL_REDUCTION STATE_COMPRESSION STUBBORN_SETS
------------------- QUERY 14 ----------------------
No solution found
Parameters: -s DFS -d 10 ./model.pnml ./CTLFireability.xml -x 14
Parameters: -s DFS -q 0 -d 10 ./model.pnml ./CTLFireability.xml -x 14
------------------- QUERY 15 ----------------------
No solution found
Parameters: -s DFS -d 10 ./model.pnml ./CTLFireability.xml -x 15
Parameters: -s DFS -q 0 -d 10 ./model.pnml ./CTLFireability.xml -x 15
------------------- QUERY 16 ----------------------
No solution found
Parameters: -s DFS -d 10 ./model.pnml ./CTLFireability.xml -x 16
Parameters: -s DFS -q 0 -d 10 ./model.pnml ./CTLFireability.xml -x 16
Search=DFS,Trace=DISABLED,State_Space_Exploration=DISABLED,Structural_Reduction=AGGRESSIVE,Struct_Red_Timout=10,Stubborn_Reduction=ENABLED,Query_Simplication=ENABLED,QSTimeout=30,Siphon_Trap=DISABLED,LPSolve_Timeout=10
Query before reduction: (((not EF (((pbl_2_2_2_1 >= 1) and (po_d1_n1_3_2_2_1 >= 1)) and ((pbl_1_2_1_2 >= 1) and (po_d2_n1_1_3_1_2 >= 1)))) and ((pbl_2_3_3_2 >= 1) and (po_d2_n1_2_4_3_2 >= 1))) or A (EF ((pb_d3_n2_2_3_2_2 >= 1) and (pil_d3_n1_2_3_3_2 >= 1)) U ((((pbl_2_3_3_2 >= 1) and (po_d1_n1_3_3_3_2 >= 1)) and ((pbl_3_2_3_2 >= 1) and (po_d2_n1_3_3_3_2 >= 1))) or (((pbl_1_1_1_2 >= 1) and (pi_d4_n1_1_1_1_2 >= 1)) or ((pbl_1_2_1_1 >= 1) and (pi_d1_n1_1_2_1_1 >= 1))))))
Query after reduction: ((AG (((pbl_2_2_2_1 < 1) or (po_d1_n1_3_2_2_1 < 1)) or ((pbl_1_2_1_2 < 1) or (po_d2_n1_1_3_1_2 < 1))) and ((pbl_2_3_3_2 >= 1) and (po_d2_n1_2_4_3_2 >= 1))) or A (EF ((pb_d3_n2_2_3_2_2 >= 1) and (pil_d3_n1_2_3_3_2 >= 1)) U ((((pbl_2_3_3_2 >= 1) and (po_d1_n1_3_3_3_2 >= 1)) and ((pbl_3_2_3_2 >= 1) and (po_d2_n1_3_3_3_2 >= 1))) or (((pbl_1_1_1_2 >= 1) and (pi_d4_n1_1_1_1_2 >= 1)) or ((pbl_1_2_1_1 >= 1) and (pi_d1_n1_1_2_1_1 >= 1))))))
Query size reduced from 65 to 65 nodes (0.00 percent reduction).
Query reduction finished after 1.700194 seconds.
terminate called after throwing an instance of 'std::bad_alloc'
what(): std::bad_alloc
/home/mcc/BenchKit/start.sh: line 6: 734 Aborted /home/mcc/BenchKit/bin/verifypn-linux64 -s DFS -d 10 ./model.pnml ./CTLFireability.xml -x 16
---------------------------------------------------
Step 2: Sequential processing
---------------------------------------------------
Remaining queries are verified sequentially.
Each query is verified for a dynamic timeout (at least 400 seconds)
------------------- QUERY 1 ----------------------
Running query 1 for 400 seconds. Remaining: 8 queries and 2802 seconds
Parameters: -s DFS -d 100 -q 100 ./model.pnml ./CTLFireability.xml -x 1
No solution found
------------------- QUERY 2 ----------------------
Running query 2 for 400 seconds. Remaining: 7 queries and 2401 seconds
Parameters: -s DFS -d 100 -q 100 ./model.pnml ./CTLFireability.xml -x 2
No solution found
------------------- QUERY 5 ----------------------
Running query 5 for 400 seconds. Remaining: 6 queries and 2001 seconds
Parameters: -s DFS -d 100 -q 100 ./model.pnml ./CTLFireability.xml -x 5
No solution found
------------------- QUERY 7 ----------------------
Running query 7 for 400 seconds. Remaining: 5 queries and 1834 seconds
Parameters: -s DFS -d 100 -q 100 ./model.pnml ./CTLFireability.xml -x 7
No solution found
------------------- QUERY 10 ----------------------
Running query 10 for 400 seconds. Remaining: 4 queries and 1434 seconds
Parameters: -s DFS -d 100 -q 100 ./model.pnml ./CTLFireability.xml -x 10
No solution found
------------------- QUERY 14 ----------------------
Running query 14 for 400 seconds. Remaining: 3 queries and 1033 seconds
Parameters: -s DFS -d 100 -q 100 ./model.pnml ./CTLFireability.xml -x 14
No solution found
------------------- QUERY 15 ----------------------
Running query 15 for 400 seconds. Remaining: 2 queries and 633 seconds
Parameters: -s DFS -d 100 -q 100 ./model.pnml ./CTLFireability.xml -x 15
No solution found
------------------- QUERY 16 ----------------------
Running query 16 for 433 seconds. Remaining: 1 queries and 433 seconds
Parameters: -s DFS -d 100 -q 100 ./model.pnml ./CTLFireability.xml -x 16
Search=DFS,Trace=DISABLED,State_Space_Exploration=DISABLED,Structural_Reduction=AGGRESSIVE,Struct_Red_Timout=100,Stubborn_Reduction=ENABLED,Query_Simplication=ENABLED,QSTimeout=100,Siphon_Trap=DISABLED,LPSolve_Timeout=10
Query before reduction: (((not EF (((pbl_2_2_2_1 >= 1) and (po_d1_n1_3_2_2_1 >= 1)) and ((pbl_1_2_1_2 >= 1) and (po_d2_n1_1_3_1_2 >= 1)))) and ((pbl_2_3_3_2 >= 1) and (po_d2_n1_2_4_3_2 >= 1))) or A (EF ((pb_d3_n2_2_3_2_2 >= 1) and (pil_d3_n1_2_3_3_2 >= 1)) U ((((pbl_2_3_3_2 >= 1) and (po_d1_n1_3_3_3_2 >= 1)) and ((pbl_3_2_3_2 >= 1) and (po_d2_n1_3_3_3_2 >= 1))) or (((pbl_1_1_1_2 >= 1) and (pi_d4_n1_1_1_1_2 >= 1)) or ((pbl_1_2_1_1 >= 1) and (pi_d1_n1_1_2_1_1 >= 1))))))
Query after reduction: ((AG (((pbl_2_2_2_1 < 1) or (po_d1_n1_3_2_2_1 < 1)) or ((pbl_1_2_1_2 < 1) or (po_d2_n1_1_3_1_2 < 1))) and ((pbl_2_3_3_2 >= 1) and (po_d2_n1_2_4_3_2 >= 1))) or A (EF ((pb_d3_n2_2_3_2_2 >= 1) and (pil_d3_n1_2_3_3_2 >= 1)) U ((((pbl_2_3_3_2 >= 1) and (po_d1_n1_3_3_3_2 >= 1)) and ((pbl_3_2_3_2 >= 1) and (po_d2_n1_3_3_3_2 >= 1))) or (((pbl_1_1_1_2 >= 1) and (pi_d4_n1_1_1_1_2 >= 1)) or ((pbl_1_2_1_1 >= 1) and (pi_d1_n1_1_2_1_1 >= 1))))))
Query size reduced from 65 to 65 nodes (0.00 percent reduction).
Query reduction finished after 1.630531 seconds.
No solution found
---------------------------------------------------
Step 3: Multiquery processing
---------------------------------------------------
Remaining 8 queries are solved using multiquery
Time remaining: 316 seconds of the initial 3600 seconds
Running multiquery on -x 1,2,5,7,10,14,15,16 for 316 seconds
Parameters: -s DFS -d 100 -q 100 -p ./model.pnml ./CTLFireability.xml -x 1,2,5,7,10,14,15,16
Search=DFS,Trace=DISABLED,State_Space_Exploration=DISABLED,Structural_Reduction=AGGRESSIVE,Struct_Red_Timout=100,Stubborn_Reduction=DISABLED,Query_Simplication=ENABLED,QSTimeout=100,Siphon_Trap=DISABLED,LPSolve_Timeout=10
Query before reduction: (((not ((pbl_2_1_2_3 >= 1) and (po_d4_n1_2_1_2_4 >= 1))) and A ((((pbl_1_3_2_3 >= 1) and (pi_d3_n1_1_3_2_3 >= 1)) and ((pbl_1_2_3_1 >= 1) and (pi_d3_n1_1_2_3_1 >= 1))) U (not ((pbl_3_1_2_1 >= 1) and (pi_d2_n1_3_1_2_1 >= 1))))) and AF AG (not ((pbl_3_1_1_2 >= 1) and (po_d1_n1_4_1_1_2 >= 1))))
Query after reduction: ((((pbl_2_1_2_3 < 1) or (po_d4_n1_2_1_2_4 < 1)) and A ((((pbl_1_3_2_3 >= 1) and (pi_d3_n1_1_3_2_3 >= 1)) and ((pbl_1_2_3_1 >= 1) and (pi_d3_n1_1_2_3_1 >= 1))) U ((pbl_3_1_2_1 < 1) or (pi_d2_n1_3_1_2_1 < 1)))) and AF AG ((pbl_3_1_1_2 < 1) or (po_d1_n1_4_1_1_2 < 1)))
Query size reduced from 41 to 41 nodes (0.00 percent reduction).
Query reduction finished after 1.043981 seconds.
Query before reduction: E ((((pbl_3_3_2_3 >= 1) and (pi_d2_n1_3_3_2_3 >= 1)) or ((not ((pbl_1_2_1_3 >= 1) and (po_d3_n1_1_2_2_3 >= 1))) or (not ((pbl_3_1_3_2 >= 1) and (pi_d4_n1_3_1_3_2 >= 1))))) U (((((pbl_1_2_1_1 >= 1) and (po_d2_n1_1_3_1_1 >= 1)) or ((pbl_2_2_1_1 >= 1) and (pi_d2_n1_2_2_1_1 >= 1))) and ((pbl_2_3_3_2 >= 1) and (po_d4_n1_2_3_3_3 >= 1))) and AF ((pbl_3_3_1_2 >= 1) and (po_d1_n1_4_3_1_2 >= 1))))
Query after reduction: E ((((pbl_3_3_2_3 >= 1) and (pi_d2_n1_3_3_2_3 >= 1)) or (((pbl_1_2_1_3 < 1) or (po_d3_n1_1_2_2_3 < 1)) or ((pbl_3_1_3_2 < 1) or (pi_d4_n1_3_1_3_2 < 1)))) U (((((pbl_1_2_1_1 >= 1) and (po_d2_n1_1_3_1_1 >= 1)) or ((pbl_2_2_1_1 >= 1) and (pi_d2_n1_2_2_1_1 >= 1))) and ((pbl_2_3_3_2 >= 1) and (po_d4_n1_2_3_3_3 >= 1))) and AF ((pbl_3_3_1_2 >= 1) and (po_d1_n1_4_3_1_2 >= 1))))
Query size reduced from 56 to 56 nodes (0.00 percent reduction).
Query reduction finished after 1.400458 seconds.
Query before reduction: EG (not E (((pbl_2_3_1_3 >= 1) and (po_d4_n1_2_3_1_4 >= 1)) U ((pbl_3_3_2_3 >= 1) and (po_d2_n1_3_4_2_3 >= 1))))
Query after reduction: EG (not E (((pbl_2_3_1_3 >= 1) and (po_d4_n1_2_3_1_4 >= 1)) U ((pbl_3_3_2_3 >= 1) and (po_d2_n1_3_4_2_3 >= 1))))
Query size reduced from 16 to 16 nodes (0.00 percent reduction).
Query reduction finished after 0.422413 seconds.
Query before reduction: (not (A ((((pbl_3_3_1_2 >= 1) and (po_d1_n1_4_3_1_2 >= 1)) and ((pbl_1_2_1_1 >= 1) and (po_d4_n1_1_2_1_2 >= 1))) U (not ((pol_d2_n1_3_4_3_3 >= 1) and (pi_d2_n1_3_4_3_3 >= 1)))) and EF EX ((pbl_3_2_3_2 >= 1) and (po_d1_n1_4_2_3_2 >= 1))))
Query after reduction: ((not A ((((pbl_3_3_1_2 >= 1) and (po_d1_n1_4_3_1_2 >= 1)) and ((pbl_1_2_1_1 >= 1) and (po_d4_n1_1_2_1_2 >= 1))) U ((pol_d2_n1_3_4_3_3 < 1) or (pi_d2_n1_3_4_3_3 < 1)))) or AG AX ((pbl_3_2_3_2 < 1) or (po_d1_n1_4_2_3_2 < 1)))
Query size reduced from 33 to 33 nodes (0.00 percent reduction).
Query reduction finished after 0.771214 seconds.
Query before reduction: (((A (((pbl_3_1_2_1 >= 1) and (pi_d4_n1_3_1_2_1 >= 1)) U ((pbl_1_3_3_2 >= 1) and (po_d2_n1_1_4_3_2 >= 1))) or AF (((pbl_2_3_1_2 >= 1) and (pi_d2_n1_2_3_1_2 >= 1)) and ((pbl_3_2_3_2 >= 1) and (pi_d4_n1_3_2_3_2 >= 1)))) or AG ((((pbl_2_3_1_2 >= 1) and (po_d1_n1_3_3_1_2 >= 1)) or ((pbl_2_3_2_1 >= 1) and (pi_d1_n1_2_3_2_1 >= 1))) or (not ((pbl_1_3_3_1 >= 1) and (po_d1_n1_2_3_3_1 >= 1))))) and (((pbl_1_1_3_1 >= 1) and (po_d3_n1_1_1_4_1 >= 1)) or AF ((((pb_d3_n2_1_1_3_2 >= 1) and (pil_d3_n1_1_1_4_2 >= 1)) or ((pbl_2_2_3_3 >= 1) and (po_d3_n1_2_2_4_3 >= 1))) or (not ((pbl_2_1_2_1 >= 1) and (po_d4_n1_2_1_2_2 >= 1))))))
Query after reduction: (((A (((pbl_3_1_2_1 >= 1) and (pi_d4_n1_3_1_2_1 >= 1)) U ((pbl_1_3_3_2 >= 1) and (po_d2_n1_1_4_3_2 >= 1))) or AF (((pbl_2_3_1_2 >= 1) and (pi_d2_n1_2_3_1_2 >= 1)) and ((pbl_3_2_3_2 >= 1) and (pi_d4_n1_3_2_3_2 >= 1)))) or AG ((((pbl_2_3_1_2 >= 1) and (po_d1_n1_3_3_1_2 >= 1)) or ((pbl_2_3_2_1 >= 1) and (pi_d1_n1_2_3_2_1 >= 1))) or ((pbl_1_3_3_1 < 1) or (po_d1_n1_2_3_3_1 < 1)))) and (((pbl_1_1_3_1 >= 1) and (po_d3_n1_1_1_4_1 >= 1)) or AF ((((pb_d3_n2_1_1_3_2 >= 1) and (pil_d3_n1_1_1_4_2 >= 1)) or ((pbl_2_2_3_3 >= 1) and (po_d3_n1_2_2_4_3
BK_TIME_CONFINEMENT_REACHED
--------------------
content from stderr:
Command exited with non-zero status 124
Command being timed: "timeout 400 /home/mcc/BenchKit/bin/verifypn-linux64 -s DFS -d 100 -q 100 ./model.pnml ./CTLFireability.xml -x 1"
User time (seconds): 395.09
System time (seconds): 5.24
Percent of CPU this job got: 99%
Elapsed (wall clock) time (h:mm:ss or m:ss): 6:40.34
Average shared text size (kbytes): 0
Average unshared data size (kbytes): 0
Average stack size (kbytes): 0
Average total size (kbytes): 0
Maximum resident set size (kbytes): 13770064
Average resident set size (kbytes): 0
Major (requiring I/O) page faults: 0
Minor (reclaiming a frame) page faults: 3458141
Voluntary context switches: 4
Involuntary context switches: 954
Swaps: 0
File system inputs: 0
File system outputs: 0
Socket messages sent: 0
Socket messages received: 0
Signals delivered: 0
Page size (bytes): 4096
Exit status: 124
Command exited with non-zero status 124
Command being timed: "timeout 400 /home/mcc/BenchKit/bin/verifypn-linux64 -s DFS -d 100 -q 100 ./model.pnml ./CTLFireability.xml -x 2"
User time (seconds): 395.87
System time (seconds): 4.20
Percent of CPU this job got: 99%
Elapsed (wall clock) time (h:mm:ss or m:ss): 6:40.28
Average shared text size (kbytes): 0
Average unshared data size (kbytes): 0
Average stack size (kbytes): 0
Average total size (kbytes): 0
Maximum resident set size (kbytes): 11464512
Average resident set size (kbytes): 0
Major (requiring I/O) page faults: 0
Minor (reclaiming a frame) page faults: 2873563
Voluntary context switches: 4
Involuntary context switches: 955
Swaps: 0
File system inputs: 0
File system outputs: 0
Socket messages sent: 0
Socket messages received: 0
Signals delivered: 0
Page size (bytes): 4096
Exit status: 124
Command terminated by signal 11
Command being timed: "timeout 400 /home/mcc/BenchKit/bin/verifypn-linux64 -s DFS -d 100 -q 100 ./model.pnml ./CTLFireability.xml -x 5"
User time (seconds): 161.71
System time (seconds): 5.17
Percent of CPU this job got: 99%
Elapsed (wall clock) time (h:mm:ss or m:ss): 2:46.95
Average shared text size (kbytes): 0
Average unshared data size (kbytes): 0
Average stack size (kbytes): 0
Average total size (kbytes): 0
Maximum resident set size (kbytes): 14491544
Average resident set size (kbytes): 0
Major (requiring I/O) page faults: 0
Minor (reclaiming a frame) page faults: 3626231
Voluntary context switches: 3
Involuntary context switches: 461
Swaps: 0
File system inputs: 0
File system outputs: 0
Socket messages sent: 0
Socket messages received: 0
Signals delivered: 0
Page size (bytes): 4096
Exit status: 0
Command exited with non-zero status 124
Command being timed: "timeout 400 /home/mcc/BenchKit/bin/verifypn-linux64 -s DFS -d 100 -q 100 ./model.pnml ./CTLFireability.xml -x 7"
User time (seconds): 396.56
System time (seconds): 3.46
Percent of CPU this job got: 99%
Elapsed (wall clock) time (h:mm:ss or m:ss): 6:40.22
Average shared text size (kbytes): 0
Average unshared data size (kbytes): 0
Average stack size (kbytes): 0
Average total size (kbytes): 0
Maximum resident set size (kbytes): 8893724
Average resident set size (kbytes): 0
Major (requiring I/O) page faults: 0
Minor (reclaiming a frame) page faults: 2230866
Voluntary context switches: 4
Involuntary context switches: 918
Swaps: 0
File system inputs: 0
File system outputs: 0
Socket messages sent: 0
Socket messages received: 0
Signals delivered: 0
Page size (bytes): 4096
Exit status: 124
Command exited with non-zero status 124
Command being timed: "timeout 400 /home/mcc/BenchKit/bin/verifypn-linux64 -s DFS -d 100 -q 100 ./model.pnml ./CTLFireability.xml -x 10"
User time (seconds): 396.00
System time (seconds): 4.10
Percent of CPU this job got: 99%
Elapsed (wall clock) time (h:mm:ss or m:ss): 6:40.27
Average shared text size (kbytes): 0
Average unshared data size (kbytes): 0
Average stack size (kbytes): 0
Average total size (kbytes): 0
Maximum resident set size (kbytes): 10933808
Average resident set size (kbytes): 0
Major (requiring I/O) page faults: 0
Minor (reclaiming a frame) page faults: 2740888
Voluntary context switches: 4
Involuntary context switches: 1098
Swaps: 0
File system inputs: 0
File system outputs: 0
Socket messages sent: 0
Socket messages received: 0
Signals delivered: 0
Page size (bytes): 4096
Exit status: 124
Command exited with non-zero status 124
Command being timed: "timeout 400 /home/mcc/BenchKit/bin/verifypn-linux64 -s DFS -d 100 -q 100 ./model.pnml ./CTLFireability.xml -x 14"
User time (seconds): 394.87
System time (seconds): 5.26
Percent of CPU this job got: 99%
Elapsed (wall clock) time (h:mm:ss or m:ss): 6:40.34
Average shared text size (kbytes): 0
Average unshared data size (kbytes): 0
Average stack size (kbytes): 0
Average total size (kbytes): 0
Maximum resident set size (kbytes): 13621656
Average resident set size (kbytes): 0
Major (requiring I/O) page faults: 0
Minor (reclaiming a frame) page faults: 3412847
Voluntary context switches: 4
Involuntary context switches: 920
Swaps: 0
File system inputs: 0
File system outputs: 0
Socket messages sent: 0
Socket messages received: 0
Signals delivered: 0
Page size (bytes): 4096
Exit status: 124
Command terminated by signal 11
Command being timed: "timeout 400 /home/mcc/BenchKit/bin/verifypn-linux64 -s DFS -d 100 -q 100 ./model.pnml ./CTLFireability.xml -x 15"
User time (seconds): 194.89
System time (seconds): 5.00
Percent of CPU this job got: 99%
Elapsed (wall clock) time (h:mm:ss or m:ss): 3:19.98
Average shared text size (kbytes): 0
Average unshared data size (kbytes): 0
Average stack size (kbytes): 0
Average total size (kbytes): 0
Maximum resident set size (kbytes): 14499204
Average resident set size (kbytes): 0
Major (requiring I/O) page faults: 0
Minor (reclaiming a frame) page faults: 3626080
Voluntary context switches: 3
Involuntary context switches: 551
Swaps: 0
File system inputs: 0
File system outputs: 0
Socket messages sent: 0
Socket messages received: 0
Signals delivered: 0
Page size (bytes): 4096
Exit status: 0
terminate called after throwing an instance of 'std::bad_alloc'
what(): std::bad_alloc
Command terminated by signal 6
Command being timed: "timeout 433 /home/mcc/BenchKit/bin/verifypn-linux64 -s DFS -d 100 -q 100 ./model.pnml ./CTLFireability.xml -x 16"
User time (seconds): 111.89
System time (seconds): 4.92
Percent of CPU this job got: 99%
Elapsed (wall clock) time (h:mm:ss or m:ss): 1:56.87
Average shared text size (kbytes): 0
Average unshared data size (kbytes): 0
Average stack size (kbytes): 0
Average total size (kbytes): 0
Maximum resident set size (kbytes): 14480772
Average resident set size (kbytes): 0
Major (requiring I/O) page faults: 0
Minor (reclaiming a frame) page faults: 3635753
Voluntary context switches: 3
Involuntary context switches: 330
Swaps: 0
File system inputs: 0
File system outputs: 8
Socket messages sent: 0
Socket messages received: 0
Signals delivered: 0
Page size (bytes): 4096
Exit status: 0
Sequence of Actions to be Executed by the VM
This is useful if one wants to reexecute the tool in the VM from the submitted image disk.
set -x
# this is for BenchKit: configuration of major elements for the test
export BK_INPUT="HypercubeGrid-PT-C4K3P3B12"
export BK_EXAMINATION="CTLFireability"
export BK_TOOL="tapaal"
export BK_RESULT_DIR="/tmp/BK_RESULTS/OUTPUTS"
export BK_TIME_CONFINEMENT="3600"
export BK_MEMORY_CONFINEMENT="16384"
# this is specific to your benchmark or test
export BIN_DIR="$HOME/BenchKit/bin"
# remove the execution directoty if it exists (to avoid increse of .vmdk images)
if [ -d execution ] ; then
rm -rf execution
fi
tar xzf /home/mcc/BenchKit/INPUTS/HypercubeGrid-PT-C4K3P3B12.tgz
mv HypercubeGrid-PT-C4K3P3B12 execution
# this is for BenchKit: explicit launching of the test
cd execution
echo "====================================================================="
echo " Generated by BenchKit 2-3254"
echo " Executing tool tapaal"
echo " Input is HypercubeGrid-PT-C4K3P3B12, examination is CTLFireability"
echo " Time confinement is $BK_TIME_CONFINEMENT seconds"
echo " Memory confinement is 16384 MBytes"
echo " Number of cores is 4"
echo " Run identifier is r039-blw7-149440485400013"
echo "====================================================================="
echo
echo "--------------------"
echo "content from stdout:"
echo
echo "=== Data for post analysis generated by BenchKit (invocation template)"
echo
if [ "CTLFireability" = "UpperBounds" ] ; then
echo "The expected result is a vector of positive values"
echo NUM_VECTOR
elif [ "CTLFireability" != "StateSpace" ] ; then
echo "The expected result is a vector of booleans"
echo BOOL_VECTOR
else
echo "no data necessary for post analysis"
fi
echo
if [ -f "CTLFireability.txt" ] ; then
echo "here is the order used to build the result vector(from text file)"
for x in $(grep Property CTLFireability.txt | cut -d ' ' -f 2 | sort -u) ; do
echo "FORMULA_NAME $x"
done
elif [ -f "CTLFireability.xml" ] ; then # for cunf (txt files deleted;-)
echo echo "here is the order used to build the result vector(from xml file)"
for x in $(grep '
echo "FORMULA_NAME $x"
done
fi
echo
echo "=== Now, execution of the tool begins"
echo
echo -n "BK_START "
date -u +%s%3N
echo
timeout -s 9 $BK_TIME_CONFINEMENT bash -c "/home/mcc/BenchKit/BenchKit_head.sh 2> STDERR ; echo ; echo -n \"BK_STOP \" ; date -u +%s%3N"
if [ $? -eq 137 ] ; then
echo
echo "BK_TIME_CONFINEMENT_REACHED"
fi
echo
echo "--------------------"
echo "content from stderr:"
echo
cat STDERR ;