

About the Execution of Tapaal for GPPP-PT-C0100N0000000100
| Execution Summary | |||||
| Max Memory Used (MB) |
Time wait (ms) | CPU Usage (ms) | I/O Wait (ms) | Computed Result | Execution Status |
| 14330.620 | 2445592.00 | 2983413.00 | 1277.60 | TF????T??T?T??FF | normal |
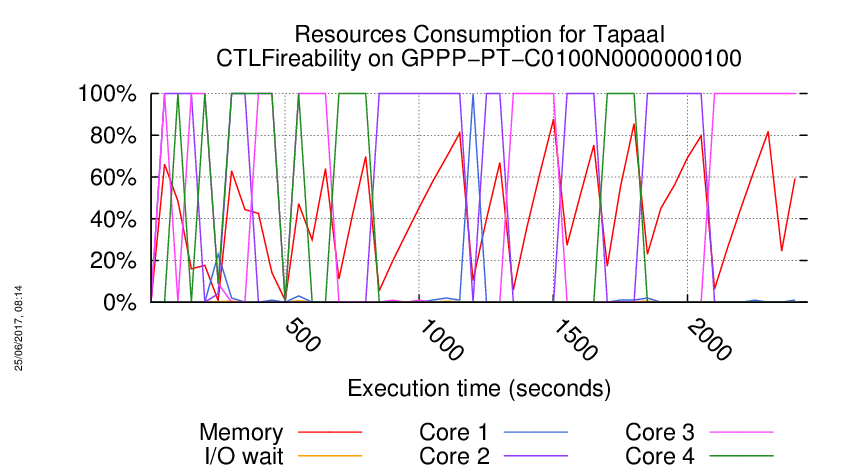
Execution Chart
We display below the execution chart for this examination (boot time has been removed).
Trace from the execution
Waiting for the VM to be ready (probing ssh)
......
=====================================================================
Generated by BenchKit 2-3254
Executing tool tapaal
Input is GPPP-PT-C0100N0000000100, examination is CTLFireability
Time confinement is 3600 seconds
Memory confinement is 16384 MBytes
Number of cores is 4
Run identifier is r029-blw3-149440265800535
=====================================================================
--------------------
content from stdout:
=== Data for post analysis generated by BenchKit (invocation template)
The expected result is a vector of booleans
BOOL_VECTOR
here is the order used to build the result vector(from text file)
FORMULA_NAME GPPP-PT-C0100N0000000100-CTLFireability-0
FORMULA_NAME GPPP-PT-C0100N0000000100-CTLFireability-1
FORMULA_NAME GPPP-PT-C0100N0000000100-CTLFireability-10
FORMULA_NAME GPPP-PT-C0100N0000000100-CTLFireability-11
FORMULA_NAME GPPP-PT-C0100N0000000100-CTLFireability-12
FORMULA_NAME GPPP-PT-C0100N0000000100-CTLFireability-13
FORMULA_NAME GPPP-PT-C0100N0000000100-CTLFireability-14
FORMULA_NAME GPPP-PT-C0100N0000000100-CTLFireability-15
FORMULA_NAME GPPP-PT-C0100N0000000100-CTLFireability-2
FORMULA_NAME GPPP-PT-C0100N0000000100-CTLFireability-3
FORMULA_NAME GPPP-PT-C0100N0000000100-CTLFireability-4
FORMULA_NAME GPPP-PT-C0100N0000000100-CTLFireability-5
FORMULA_NAME GPPP-PT-C0100N0000000100-CTLFireability-6
FORMULA_NAME GPPP-PT-C0100N0000000100-CTLFireability-7
FORMULA_NAME GPPP-PT-C0100N0000000100-CTLFireability-8
FORMULA_NAME GPPP-PT-C0100N0000000100-CTLFireability-9
=== Now, execution of the tool begins
BK_START 1494800290340
---> tapaal --- TAPAAL
Total timeout: 3600
*************************************
* TAPAAL verifying CTLFireability *
*************************************
---------------------------------------------------
Step 1: Parallel processing
---------------------------------------------------
Doing parallel verification of individual queries (16 in total)
Each query is verified by 2 parallel strategies for 60 seconds
------------------- QUERY 1 ----------------------
Solution found
Parameters: -s DFS -q 0 -d 10 ./model.pnml ./CTLFireability.xml -x 1
Parameters: -s DFS -d 10 ./model.pnml ./CTLFireability.xml -x 1
Search=DFS,Trace=DISABLED,State_Space_Exploration=DISABLED,Structural_Reduction=AGGRESSIVE,Struct_Red_Timout=10,Stubborn_Reduction=ENABLED,Query_Simplication=DISABLED,Siphon_Trap=DISABLED,LPSolve_Timeout=10
Query is satisfied.
STATS:
Time (seconds): 0.002314
Configurations: 830
Markings: 828
Edges: 814
Processed Edges: 1214
Processed N. Edges: 2
Explored Configs: 814
Query: ((tokens-count(c1) ge integer-constant(700) & (tokens-count(GAP) ge integer-constant(1) & tokens-count(S7P) ge integer-constant(1))) | EX!(AF(tokens-count(ATP) ge integer-constant(1) & tokens-count(F6P) ge integer-constant(1))))
parallel: This job succeeded:
/home/mcc/BenchKit/start.sh 14500000 /home/mcc/BenchKit/bin/verifypn-linux64 -s\ DFS\ -q\ 0\ -d\ 10 ./model.pnml ./CTLFireability.xml -x 1
FORMULA GPPP-PT-C0100N0000000100-CTLFireability-0 TRUE TECHNIQUES COLLATERAL_PROCESSING EXPLICIT STRUCTURAL_REDUCTION STATE_COMPRESSION STUBBORN_SETS
------------------- QUERY 2 ----------------------
Solution found
Parameters: -s DFS -d 10 ./model.pnml ./CTLFireability.xml -x 2
Parameters: -s DFS -q 0 -d 10 ./model.pnml ./CTLFireability.xml -x 2
Search=DFS,Trace=DISABLED,State_Space_Exploration=DISABLED,Structural_Reduction=AGGRESSIVE,Struct_Red_Timout=10,Stubborn_Reduction=ENABLED,Query_Simplication=DISABLED,Siphon_Trap=DISABLED,LPSolve_Timeout=10
Query is NOT satisfied.
STATS:
Time (seconds): 0.000147
Configurations: 83
Markings: 76
Edges: 84
Processed Edges: 61
Processed N. Edges: 2
Explored Configs: 30
Query: (!(EF(tokens-count(Xu5P) ge integer-constant(1) & tokens-count(E4P) ge integer-constant(1))) | (!(EF!(!(!((tokens-count(NADH) ge integer-constant(1) & tokens-count(Pyr) ge integer-constant(1)))))) & (AF(tokens-count(_2PG) ge integer-constant(1) & (tokens-count(a1) ge integer-constant(200) & tokens-count(Ru5P) ge integer-constant(1))) & EX(tokens-count(GAP) ge integer-constant(1) & (tokens-count(Gluc) ge integer-constant(1) & tokens-count(ATP) ge integer-constant(1))))))
parallel: This job succeeded:
/home/mcc/BenchKit/start.sh 14500000 /home/mcc/BenchKit/bin/verifypn-linux64 -s\ DFS\ -q\ 0\ -d\ 10 ./model.pnml ./CTLFireability.xml -x 2
FORMULA GPPP-PT-C0100N0000000100-CTLFireability-1 FALSE TECHNIQUES COLLATERAL_PROCESSING EXPLICIT STRUCTURAL_REDUCTION STATE_COMPRESSION STUBBORN_SETS
------------------- QUERY 3 ----------------------
No solution found
Parameters: -s DFS -d 10 ./model.pnml ./CTLFireability.xml -x 3
Parameters: -s DFS -q 0 -d 10 ./model.pnml ./CTLFireability.xml -x 3
------------------- QUERY 4 ----------------------
Solution found
Parameters: -s DFS -d 10 ./model.pnml ./CTLFireability.xml -x 4
Parameters: -s DFS -q 0 -d 10 ./model.pnml ./CTLFireability.xml -x 4
Search=DFS,Trace=DISABLED,State_Space_Exploration=DISABLED,Structural_Reduction=AGGRESSIVE,Struct_Red_Timout=10,Stubborn_Reduction=ENABLED,Query_Simplication=DISABLED,Siphon_Trap=DISABLED,LPSolve_Timeout=10
Query is satisfied.
STATS:
Time (seconds): 0.002319
Configurations: 830
Markings: 828
Edges: 814
Processed Edges: 1214
Processed N. Edges: 2
Explored Configs: 814
Query: AX((((tokens-count(_2PG) ge integer-constant(1) & (tokens-count(ATP) ge integer-constant(1) & tokens-count(F6P) ge integer-constant(1))) | (tokens-count(c1) ge integer-constant(700) & (tokens-count(GAP) ge integer-constant(1) & tokens-count(S7P) ge integer-constant(1)))) | (((tokens-count(_1_3_BPG) ge integer-constant(1) & tokens-count(ADP) ge integer-constant(1)) | (tokens-count(NADH) ge integer-constant(1) & tokens-count(Pyr) ge integer-constant(1))) & !(tokens-count(_3PG) ge integer-constant(1)))) | !(AF!(!((tokens-count(ATP) ge integer-constant(1) & tokens-count(F6P) ge integer-constant(1))))))
parallel: This job succeeded:
/home/mcc/BenchKit/start.sh 14500000 /home/mcc/BenchKit/bin/verifypn-linux64 -s\ DFS\ -q\ 0\ -d\ 10 ./model.pnml ./CTLFireability.xml -x 4
FORMULA GPPP-PT-C0100N0000000100-CTLFireability-3 TRUE TECHNIQUES COLLATERAL_PROCESSING EXPLICIT STRUCTURAL_REDUCTION STATE_COMPRESSION STUBBORN_SETS
------------------- QUERY 5 ----------------------
No solution found
Parameters: -s DFS -d 10 ./model.pnml ./CTLFireability.xml -x 5
Parameters: -s DFS -q 0 -d 10 ./model.pnml ./CTLFireability.xml -x 5
------------------- QUERY 6 ----------------------
Solution found
Parameters: -s DFS -d 10 ./model.pnml ./CTLFireability.xml -x 6
Parameters: -s DFS -q 0 -d 10 ./model.pnml ./CTLFireability.xml -x 6
Search=DFS,Trace=DISABLED,State_Space_Exploration=DISABLED,Structural_Reduction=AGGRESSIVE,Struct_Red_Timout=10,Stubborn_Reduction=ENABLED,Query_Simplication=DISABLED,Siphon_Trap=DISABLED,LPSolve_Timeout=10
Query is satisfied.
STATS:
Time (seconds): 0.0107
Configurations: 4591
Markings: 5089
Edges: 5775
Processed Edges: 4591
Processed N. Edges: 0
Explored Configs: 1703
Query: E(!(tokens-count(GSH) ge integer-constant(2))) U ((tokens-count(NADH) ge integer-constant(1) & tokens-count(Pyr) ge integer-constant(1)))
Search=DFS,Trace=DISABLED,State_Space_Exploration=DISABLED,Structural_Reduction=AGGRESSIVE,Struct_Red_Timout=10,Stubborn_Reduction=ENABLED,Query_Simplication=ENABLED,QSTimeout=30,Siphon_Trap=DISABLED,LPSolve_Timeout=10
Query before reduction: E ((not (GSH >= 2)) U ((NADH >= 1) and (Pyr >= 1)))
Query after reduction: E ((GSH < 2) U ((NADH >= 1) and (Pyr >= 1)))
Query size reduced from 11 to 11 nodes (0.00 percent reduction).
Query reduction finished after 0.001729 seconds.
Query is satisfied.
STATS:
Time (seconds): 0.01058
Configurations: 4591
Markings: 5089
Edges: 5775
Processed Edges: 4591
Processed N. Edges: 0
Explored Configs: 1703
Query: E(tokens-count(GSH) ls integer-constant(2)) U ((tokens-count(NADH) ge integer-constant(1) & tokens-count(Pyr) ge integer-constant(1)))
parallel: This job succeeded:
/home/mcc/BenchKit/start.sh 7250000 /home/mcc/BenchKit/bin/verifypn-linux64 -s\ DFS\ -d\ 10 ./model.pnml ./CTLFireability.xml -x 6
FORMULA GPPP-PT-C0100N0000000100-CTLFireability-5 TRUE TECHNIQUES COLLATERAL_PROCESSING EXPLICIT STRUCTURAL_REDUCTION STATE_COMPRESSION STUBBORN_SETS
------------------- QUERY 7 ----------------------
No solution found
Parameters: -s DFS -d 10 ./model.pnml ./CTLFireability.xml -x 7
Parameters: -s DFS -q 0 -d 10 ./model.pnml ./CTLFireability.xml -x 7
------------------- QUERY 8 ----------------------
No solution found
Parameters: -s DFS -d 10 ./model.pnml ./CTLFireability.xml -x 8
Parameters: -s DFS -q 0 -d 10 ./model.pnml ./CTLFireability.xml -x 8
------------------- QUERY 9 ----------------------
Solution found
Parameters: -s DFS -d 10 ./model.pnml ./CTLFireability.xml -x 9
Search=DFS,Trace=DISABLED,State_Space_Exploration=DISABLED,Structural_Reduction=AGGRESSIVE,Struct_Red_Timout=10,Stubborn_Reduction=ENABLED,Query_Simplication=ENABLED,QSTimeout=30,Siphon_Trap=DISABLED,LPSolve_Timeout=10
Query before reduction: EF (EF ((Lac >= 700) and (ATP >= 700)) and (not EF (_2PG >= 1)))
Query after reduction: false
Query size reduced from 14 to 1 nodes (92.86 percent reduction).
Query reduction finished after 0.000453 seconds.
Query is NOT satisfied.
Query solved by Query Simplification.
parallel: This job succeeded:
/home/mcc/BenchKit/start.sh 7250000 /home/mcc/BenchKit/bin/verifypn-linux64 -s\ DFS\ -d\ 10 ./model.pnml ./CTLFireability.xml -x 9
FORMULA GPPP-PT-C0100N0000000100-CTLFireability-8 FALSE TECHNIQUES COLLATERAL_PROCESSING EXPLICIT STRUCTURAL_REDUCTION STATE_COMPRESSION STUBBORN_SETS
------------------- QUERY 10 ----------------------
Solution found
Parameters: -s DFS -d 10 ./model.pnml ./CTLFireability.xml -x 10
Parameters: -s DFS -q 0 -d 10 ./model.pnml ./CTLFireability.xml -x 10
Search=DFS,Trace=DISABLED,State_Space_Exploration=DISABLED,Structural_Reduction=AGGRESSIVE,Struct_Red_Timout=10,Stubborn_Reduction=ENABLED,Query_Simplication=ENABLED,QSTimeout=30,Siphon_Trap=DISABLED,LPSolve_Timeout=10
Query before reduction: ((not AG EX ((Lac >= 700) and (ATP >= 700))) and (not (EF (((NADH >= 1) and (Pyr >= 1)) and ((c2 >= 1) and ((Pi >= 1) and ((NADplus >= 1) and (GAP >= 1))))) or (not ((not (GSH >= 2)) or ((_2PG >= 1) and ((c1 >= 700) and ((GAP >= 1) and (S7P >= 1)))))))))
Query after reduction: (EF AX ((Lac < 700) or (ATP < 700)) and (AG (((NADH < 1) or (Pyr < 1)) or ((c2 < 1) or ((Pi < 1) or (GAP < 1)))) and (GSH < 2)))
Query size reduced from 54 to 34 nodes (37.04 percent reduction).
Query reduction finished after 0.004641 seconds.
Query is NOT satisfied.
STATS:
Time (seconds): 0.05516
Configurations: 25969
Markings: 25965
Edges: 34274
Processed Edges: 20843
Processed N. Edges: 2
Explored Configs: 6959
Query: (EFAX(tokens-count(Lac) ls integer-constant(700) | tokens-count(ATP) ls integer-constant(700)) & (!(EF!(((tokens-count(NADH) ls integer-constant(1) | tokens-count(Pyr) ls integer-constant(1)) | (tokens-count(c2) ls integer-constant(1) | (tokens-count(Pi) ls integer-constant(1) | tokens-count(GAP) ls integer-constant(1)))))) & tokens-count(GSH) ls integer-constant(2)))
Search=DFS,Trace=DISABLED,State_Space_Exploration=DISABLED,Structural_Reduction=AGGRESSIVE,Struct_Red_Timout=10,Stubborn_Reduction=ENABLED,Query_Simplication=DISABLED,Siphon_Trap=DISABLED,LPSolve_Timeout=10
Query is NOT satisfied.
STATS:
Time (seconds): 0.05496
Configurations: 25969
Markings: 25965
Edges: 34274
Processed Edges: 20843
Processed N. Edges: 2
Explored Configs: 6959
Query: (!(!(EF!(EX(tokens-count(Lac) ge integer-constant(700) & tokens-count(ATP) ge integer-constant(700))))) & !((EF((tokens-count(NADH) ge integer-constant(1) & tokens-count(Pyr) ge integer-constant(1)) & (tokens-count(c2) ge integer-constant(1) & (tokens-count(Pi) ge integer-constant(1) & (tokens-count(NADplus) ge integer-constant(1) & tokens-count(GAP) ge integer-constant(1))))) | !((!(tokens-count(GSH) ge integer-constant(2)) | (tokens-count(_2PG) ge integer-constant(1) & (tokens-count(c1) ge integer-constant(700) & (tokens-count(GAP) ge integer-constant(1) & tokens-count(S7P) ge integer-constant(1)))))))))
parallel: This job succeeded:
/home/mcc/BenchKit/start.sh 14500000 /home/mcc/BenchKit/bin/verifypn-linux64 -s\ DFS\ -q\ 0\ -d\ 10 ./model.pnml ./CTLFireability.xml -x 10
FORMULA GPPP-PT-C0100N0000000100-CTLFireability-9 FALSE TECHNIQUES COLLATERAL_PROCESSING EXPLICIT STRUCTURAL_REDUCTION STATE_COMPRESSION STUBBORN_SETS
------------------- QUERY 11 ----------------------
No solution found
Parameters: -s DFS -d 10 ./model.pnml ./CTLFireability.xml -x 11
Parameters: -s DFS -q 0 -d 10 ./model.pnml ./CTLFireability.xml -x 11
------------------- QUERY 12 ----------------------
No solution found
Parameters: -s DFS -d 10 ./model.pnml ./CTLFireability.xml -x 12
Parameters: -s DFS -q 0 -d 10 ./model.pnml ./CTLFireability.xml -x 12
------------------- QUERY 13 ----------------------
No solution found
Parameters: -s DFS -d 10 ./model.pnml ./CTLFireability.xml -x 13
Parameters: -s DFS -q 0 -d 10 ./model.pnml ./CTLFireability.xml -x 13
/home/mcc/BenchKit/start.sh: line 6: 663 Segmentation fault /home/mcc/BenchKit/bin/verifypn-linux64 -s DFS -d 10 ./model.pnml ./CTLFireability.xml -x 13
------------------- QUERY 14 ----------------------
No solution found
Parameters: -s DFS -d 10 ./model.pnml ./CTLFireability.xml -x 14
Parameters: -s DFS -q 0 -d 10 ./model.pnml ./CTLFireability.xml -x 14
------------------- QUERY 15 ----------------------
Solution found
Parameters: -s DFS -d 10 ./model.pnml ./CTLFireability.xml -x 15
Parameters: -s DFS -q 0 -d 10 ./model.pnml ./CTLFireability.xml -x 15
Search=DFS,Trace=DISABLED,State_Space_Exploration=DISABLED,Structural_Reduction=AGGRESSIVE,Struct_Red_Timout=10,Stubborn_Reduction=ENABLED,Query_Simplication=ENABLED,QSTimeout=30,Siphon_Trap=DISABLED,LPSolve_Timeout=10
Query before reduction: (not (not EF EX ((ADP >= 1) and (PEP >= 1))))
Query after reduction: EF EX ((ADP >= 1) and (PEP >= 1))
Query size reduced from 9 to 9 nodes (0.00 percent reduction).
Query reduction finished after 0.001755 seconds.
Query is satisfied.
STATS:
Time (seconds): 0.07522
Configurations: 32912
Markings: 25959
Edges: 41218
Processed Edges: 34739
Processed N. Edges: 0
Explored Configs: 13906
Query: EFEX(tokens-count(ADP) ge integer-constant(1) & tokens-count(PEP) ge integer-constant(1))
parallel: This job succeeded:
/home/mcc/BenchKit/start.sh 7250000 /home/mcc/BenchKit/bin/verifypn-linux64 -s\ DFS\ -d\ 10 ./model.pnml ./CTLFireability.xml -x 15
FORMULA GPPP-PT-C0100N0000000100-CTLFireability-14 TRUE TECHNIQUES COLLATERAL_PROCESSING EXPLICIT STRUCTURAL_REDUCTION STATE_COMPRESSION STUBBORN_SETS
------------------- QUERY 16 ----------------------
No solution found
Parameters: -s DFS -d 10 ./model.pnml ./CTLFireability.xml -x 16
Parameters: -s DFS -q 0 -d 10 ./model.pnml ./CTLFireability.xml -x 16
---------------------------------------------------
Step 2: Sequential processing
---------------------------------------------------
Remaining queries are verified sequentially.
Each query is verified for a dynamic timeout (at least 400 seconds)
------------------- QUERY 3 ----------------------
Running query 3 for 400 seconds. Remaining: 9 queries and 3038 seconds
Parameters: -s DFS -d 100 -q 100 ./model.pnml ./CTLFireability.xml -x 3
No solution found
------------------- QUERY 5 ----------------------
Running query 5 for 400 seconds. Remaining: 8 queries and 2914 seconds
Parameters: -s DFS -d 100 -q 100 ./model.pnml ./CTLFireability.xml -x 5
No solution found
------------------- QUERY 7 ----------------------
Running query 7 for 400 seconds. Remaining: 7 queries and 2763 seconds
Parameters: -s DFS -d 100 -q 100 ./model.pnml ./CTLFireability.xml -x 7
No solution found
------------------- QUERY 8 ----------------------
Running query 8 for 402 seconds. Remaining: 6 queries and 2414 seconds
Parameters: -s DFS -d 100 -q 100 ./model.pnml ./CTLFireability.xml -x 8
No solution found
------------------- QUERY 11 ----------------------
Running query 11 for 451 seconds. Remaining: 5 queries and 2257 seconds
Parameters: -s DFS -d 100 -q 100 ./model.pnml ./CTLFireability.xml -x 11
Search=DFS,Trace=DISABLED,State_Space_Exploration=DISABLED,Structural_Reduction=AGGRESSIVE,Struct_Red_Timout=100,Stubborn_Reduction=ENABLED,Query_Simplication=ENABLED,QSTimeout=100,Siphon_Trap=DISABLED,LPSolve_Timeout=10
Query before reduction: (AX EF (((a1 >= 200) and (Ru5P >= 1)) and (_3PG >= 1)) or AG (not ((((c2 >= 1) and ((Pi >= 1) and ((NADplus >= 1) and (GAP >= 1)))) and ((Gluc >= 1) and (ATP >= 1))) and ((a1 >= 200) and (Ru5P >= 1)))))
Query after reduction: (AX EF (((a1 >= 200) and (Ru5P >= 1)) and (_3PG >= 1)) or AG ((((c2 < 1) or ((Pi < 1) or (GAP < 1))) or ((Gluc < 1) or (ATP < 1))) or ((a1 < 200) or (Ru5P < 1))))
Query size reduced from 46 to 42 nodes (8.70 percent reduction).
Query reduction finished after 0.003395 seconds.
No solution found
------------------- QUERY 12 ----------------------
Running query 12 for 524 seconds. Remaining: 4 queries and 2097 seconds
Parameters: -s DFS -d 100 -q 100 ./model.pnml ./CTLFireability.xml -x 12
No solution found
------------------- QUERY 13 ----------------------
Running query 13 for 640 seconds. Remaining: 3 queries and 1920 seconds
Parameters: -s DFS -d 100 -q 100 ./model.pnml ./CTLFireability.xml -x 13
No solution found
------------------- QUERY 14 ----------------------
Running query 14 for 897 seconds. Remaining: 2 queries and 1794 seconds
Parameters: -s DFS -d 100 -q 100 ./model.pnml ./CTLFireability.xml -x 14
No solution found
------------------- QUERY 16 ----------------------
Running query 16 for 1511 seconds. Remaining: 1 queries and 1511 seconds
Parameters: -s DFS -d 100 -q 100 ./model.pnml ./CTLFireability.xml -x 16
No solution found
---------------------------------------------------
Step 3: Multiquery processing
---------------------------------------------------
Remaining 9 queries are solved using multiquery
Time remaining: 1280 seconds of the initial 3600 seconds
Running multiquery on -x 3,5,7,8,11,12,13,14,16 for 1280 seconds
Parameters: -s DFS -d 100 -q 100 -p ./model.pnml ./CTLFireability.xml -x 3,5,7,8,11,12,13,14,16
Search=DFS,Trace=DISABLED,State_Space_Exploration=DISABLED,Structural_Reduction=AGGRESSIVE,Struct_Red_Timout=100,Stubborn_Reduction=DISABLED,Query_Simplication=ENABLED,QSTimeout=100,Siphon_Trap=DISABLED,LPSolve_Timeout=10
Query before reduction: (not EF (((b1 >= 300) and (G6P >= 1)) and AF ((ADP >= 1) and (PEP >= 1))))
Query after reduction: AG (((b1 < 300) or (G6P < 1)) or EG ((ADP < 1) or (PEP < 1)))
Query size reduced from 17 to 17 nodes (0.00 percent reduction).
Query reduction finished after 0.000903 seconds.
Query before reduction: AX EF AG ((a2 >= 1) and (Ru5P >= 1))
Query after reduction: AX EF AG ((a2 >= 1) and (Ru5P >= 1))
Query size reduced from 10 to 10 nodes (0.00 percent reduction).
Query reduction finished after 0.000756 seconds.
Query before reduction: AF EX AF (DHAP >= 1)
Query after reduction: AF EX AF (DHAP >= 1)
Query size reduced from 6 to 6 nodes (0.00 percent reduction).
Query reduction finished after 0.000308 seconds.
Query before reduction: (((not ((R5P >= 1) and (Xu5P >= 1))) and (not ((not (((ATP >= 1) and (F6P >= 1)) and ((a1 >= 200) and (Ru5P >= 1)))) or (not (((_1_3_BPG >= 1) and (ADP >= 1)) and ((ADP >= 1) and (PEP >= 1))))))) or ((AG (not ((Lac >= 700) and (ATP >= 700))) and (((b1 >= 300) and (G6P >= 1)) or (not ((a1 >= 200) and (Ru5P >= 1))))) or ((((((c1 >= 700) and ((GAP >= 1) and (S7P >= 1))) or (_2PG >= 1)) or (not ((_1_3_BPG >= 1) and (ADP >= 1)))) or (((c1 >= 700) and ((GAP >= 1) and (S7P >= 1))) and (((Xu5P >= 1) and (E4P >= 1)) or ((a2 >= 1) and (Ru5P >= 1))))) and ((c1 >= 700) and ((GAP >= 1) and (S7P >= 1))))))
Query after reduction: ((((R5P < 1) or (Xu5P < 1)) and ((((ATP >= 1) and (F6P >= 1)) and ((a1 >= 200) and (Ru5P >= 1))) and (((_1_3_BPG >= 1) and (ADP >= 1)) and ((ADP >= 1) and (PEP >= 1))))) or ((AG ((Lac < 700) or (ATP < 700)) and (((b1 >= 300) and (G6P >= 1)) or ((a1 < 200) or (Ru5P < 1)))) or ((((((c1 >= 700) and ((GAP >= 1) and (S7P >= 1))) or (_2PG >= 1)) or ((_1_3_BPG < 1) or (ADP < 1))) or (((c1 >= 700) and ((GAP >= 1) and (S7P >= 1))) and (((Xu5P >= 1) and (E4P >= 1)) or ((a2 >= 1) and (Ru5P >= 1))))) and ((c1 >= 700) and ((GAP >= 1) and (S7P >= 1))))))
Query size reduced from 128 to 128 nodes (0.00 percent reduction).
Query reduction finished after 0.013493 seconds.
Query before reduction: (AX EF (((a1 >= 200) and (Ru5P >= 1)) and (_3PG >= 1)) or AG (not ((((c2 >= 1) and ((Pi >= 1) and ((NADplus >= 1) and (GAP >= 1)))) and ((Gluc >= 1) and (ATP >= 1))) and ((a1 >= 200) and (Ru5P >= 1)))))
Query after reduction: (AX EF (((a1 >= 200) and (Ru5P >= 1)) and (_3PG >= 1)) or AG ((((c2 < 1) or ((Pi < 1) or (GAP < 1))) or ((Gluc < 1) or (ATP < 1))) or ((a1 < 200) or (Ru5P < 1))))
Query size reduced from 46 to 42 nodes (8.70 percent reduction).
Query reduction finished after 0.003106 seconds.
Query before reduction: AG ((((c1 >= 700) and ((GAP >= 1) and (S7P >= 1))) or EF (GAP >= 1)) or AX (((NADH >= 1) and (Pyr >= 1)) and ((Gluc >= 1) and (ATP >= 1))))
Query after reduction: AG ((((c1 >= 700) and ((GAP >= 1) and (S7P >= 1))) or EF (GAP >= 1)) or AX (((NADH >= 1) and (Pyr >= 1)) and ((Gluc >= 1) and (ATP >= 1))))
Query size reduced from 34 to 34 nodes (0.00 percent reduction).
Query reduction finished after 0.003832 seconds.
Query before reduction: AF A ((((_1_3_BPG >= 1) and (ADP >= 1)) and ((ATP >= 1) and (F6P >= 1))) U ((ATP >= 1) and (F6P >= 1)))
Query after reduction: AF A ((((_1_3_BPG >= 1) and (ADP >= 1)) and ((ATP >= 1) and (F6P >= 1))) U ((ATP >= 1) and (F6P >= 1)))
Query size reduced from 24 to 24 nodes (0.00 percent reduction).
Query reduction finished after 0.002787 seconds.
Query before reduction: AF EG (not ((DHAP >= 1) or ((b1 >= 300) and (G6P >= 1))))
Query after reduction: AF EG ((DHAP < 1) and ((b1 < 300) or (G6P < 1)))
Query size reduced from 13 to 13 nodes (0.00 percent reduction).
Query reduction finished after 0.000787 seconds.
Query before reduction: EG (not (EG (GAP >= 1) or ((_1_3_BPG >= 1) and (ADP >= 1))))
Query after reduction: EG (AF (GAP < 1) and ((_1_3_BPG < 1) or (ADP < 1)))
Query size reduced from 13 to 13 nodes (0.00 pEnd of script.
BK_STOP 1494802735932
--------------------
content from stderr:
Command terminated by signal 11
Command being timed: "timeout 400 /home/mcc/BenchKit/bin/verifypn-linux64 -s DFS -d 100 -q 100 ./model.pnml ./CTLFireability.xml -x 3"
User time (seconds): 118.32
System time (seconds): 5.49
Percent of CPU this job got: 99%
Elapsed (wall clock) time (h:mm:ss or m:ss): 2:03.89
Average shared text size (kbytes): 0
Average unshared data size (kbytes): 0
Average stack size (kbytes): 0
Average total size (kbytes): 0
Maximum resident set size (kbytes): 14499432
Average resident set size (kbytes): 0
Major (requiring I/O) page faults: 0
Minor (reclaiming a frame) page faults: 3624438
Voluntary context switches: 3
Involuntary context switches: 344
Swaps: 0
File system inputs: 0
File system outputs: 0
Socket messages sent: 0
Socket messages received: 0
Signals delivered: 0
Page size (bytes): 4096
Exit status: 0
Command terminated by signal 11
Command being timed: "timeout 400 /home/mcc/BenchKit/bin/verifypn-linux64 -s DFS -d 100 -q 100 ./model.pnml ./CTLFireability.xml -x 5"
User time (seconds): 145.09
System time (seconds): 5.54
Percent of CPU this job got: 99%
Elapsed (wall clock) time (h:mm:ss or m:ss): 2:30.65
Average shared text size (kbytes): 0
Average unshared data size (kbytes): 0
Average stack size (kbytes): 0
Average total size (kbytes): 0
Maximum resident set size (kbytes): 14499376
Average resident set size (kbytes): 0
Major (requiring I/O) page faults: 0
Minor (reclaiming a frame) page faults: 3624590
Voluntary context switches: 3
Involuntary context switches: 342
Swaps: 0
File system inputs: 0
File system outputs: 0
Socket messages sent: 0
Socket messages received: 0
Signals delivered: 0
Page size (bytes): 4096
Exit status: 0
Command terminated by signal 11
Command being timed: "timeout 400 /home/mcc/BenchKit/bin/verifypn-linux64 -s DFS -d 100 -q 100 ./model.pnml ./CTLFireability.xml -x 7"
User time (seconds): 343.05
System time (seconds): 5.78
Percent of CPU this job got: 99%
Elapsed (wall clock) time (h:mm:ss or m:ss): 5:48.87
Average shared text size (kbytes): 0
Average unshared data size (kbytes): 0
Average stack size (kbytes): 0
Average total size (kbytes): 0
Maximum resident set size (kbytes): 14499468
Average resident set size (kbytes): 0
Major (requiring I/O) page faults: 0
Minor (reclaiming a frame) page faults: 3626266
Voluntary context switches: 3
Involuntary context switches: 652
Swaps: 0
File system inputs: 0
File system outputs: 0
Socket messages sent: 0
Socket messages received: 0
Signals delivered: 0
Page size (bytes): 4096
Exit status: 0
Command terminated by signal 11
Command being timed: "timeout 402 /home/mcc/BenchKit/bin/verifypn-linux64 -s DFS -d 100 -q 100 ./model.pnml ./CTLFireability.xml -x 8"
User time (seconds): 151.75
System time (seconds): 5.40
Percent of CPU this job got: 99%
Elapsed (wall clock) time (h:mm:ss or m:ss): 2:37.30
Average shared text size (kbytes): 0
Average unshared data size (kbytes): 0
Average stack size (kbytes): 0
Average total size (kbytes): 0
Maximum resident set size (kbytes): 14499464
Average resident set size (kbytes): 0
Major (requiring I/O) page faults: 0
Minor (reclaiming a frame) page faults: 3624995
Voluntary context switches: 3
Involuntary context switches: 438
Swaps: 0
File system inputs: 0
File system outputs: 0
Socket messages sent: 0
Socket messages received: 0
Signals delivered: 0
Page size (bytes): 4096
Exit status: 0
terminate called after throwing an instance of 'std::bad_alloc'
what(): std::bad_alloc
Command terminated by signal 6
Command being timed: "timeout 451 /home/mcc/BenchKit/bin/verifypn-linux64 -s DFS -d 100 -q 100 ./model.pnml ./CTLFireability.xml -x 11"
User time (seconds): 154.39
System time (seconds): 5.55
Percent of CPU this job got: 99%
Elapsed (wall clock) time (h:mm:ss or m:ss): 2:40.04
Average shared text size (kbytes): 0
Average unshared data size (kbytes): 0
Average stack size (kbytes): 0
Average total size (kbytes): 0
Maximum resident set size (kbytes): 14499372
Average resident set size (kbytes): 0
Major (requiring I/O) page faults: 0
Minor (reclaiming a frame) page faults: 3624537
Voluntary context switches: 5
Involuntary context switches: 442
Swaps: 0
File system inputs: 384
File system outputs: 8
Socket messages sent: 0
Socket messages received: 0
Signals delivered: 0
Page size (bytes): 4096
Exit status: 0
Command terminated by signal 11
Command being timed: "timeout 524 /home/mcc/BenchKit/bin/verifypn-linux64 -s DFS -d 100 -q 100 ./model.pnml ./CTLFireability.xml -x 12"
User time (seconds): 171.38
System time (seconds): 5.58
Percent of CPU this job got: 99%
Elapsed (wall clock) time (h:mm:ss or m:ss): 2:56.97
Average shared text size (kbytes): 0
Average unshared data size (kbytes): 0
Average stack size (kbytes): 0
Average total size (kbytes): 0
Maximum resident set size (kbytes): 14499428
Average resident set size (kbytes): 0
Major (requiring I/O) page faults: 0
Minor (reclaiming a frame) page faults: 3624518
Voluntary context switches: 3
Involuntary context switches: 323
Swaps: 0
File system inputs: 0
File system outputs: 0
Socket messages sent: 0
Socket messages received: 0
Signals delivered: 0
Page size (bytes): 4096
Exit status: 0
Command terminated by signal 11
Command being timed: "timeout 640 /home/mcc/BenchKit/bin/verifypn-linux64 -s DFS -d 100 -q 100 ./model.pnml ./CTLFireability.xml -x 13"
User time (seconds): 120.59
System time (seconds): 5.72
Percent of CPU this job got: 99%
Elapsed (wall clock) time (h:mm:ss or m:ss): 2:06.33
Average shared text size (kbytes): 0
Average unshared data size (kbytes): 0
Average stack size (kbytes): 0
Average total size (kbytes): 0
Maximum resident set size (kbytes): 14499496
Average resident set size (kbytes): 0
Major (requiring I/O) page faults: 0
Minor (reclaiming a frame) page faults: 3624508
Voluntary context switches: 3
Involuntary context switches: 288
Swaps: 0
File system inputs: 0
File system outputs: 0
Socket messages sent: 0
Socket messages received: 0
Signals delivered: 0
Page size (bytes): 4096
Exit status: 0
Command terminated by signal 11
Command being timed: "timeout 897 /home/mcc/BenchKit/bin/verifypn-linux64 -s DFS -d 100 -q 100 ./model.pnml ./CTLFireability.xml -x 14"
User time (seconds): 276.78
System time (seconds): 5.53
Percent of CPU this job got: 99%
Elapsed (wall clock) time (h:mm:ss or m:ss): 4:42.33
Average shared text size (kbytes): 0
Average unshared data size (kbytes): 0
Average stack size (kbytes): 0
Average total size (kbytes): 0
Maximum resident set size (kbytes): 14499496
Average resident set size (kbytes): 0
Major (requiring I/O) page faults: 0
Minor (reclaiming a frame) page faults: 3631040
Voluntary context switches: 3
Involuntary context switches: 515
Swaps: 0
File system inputs: 0
File system outputs: 0
Socket messages sent: 0
Socket messages received: 0
Signals delivered: 0
Page size (bytes): 4096
Exit status: 0
Command terminated by signal 11
Command being timed: "timeout 1511 /home/mcc/BenchKit/bin/verifypn-linux64 -s DFS -d 100 -q 100 ./model.pnml ./CTLFireability.xml -x 16"
User time (seconds): 225.46
System time (seconds): 5.86
Percent of CPU this job got: 99%
Elapsed (wall clock) time (h:mm:ss or m:ss): 3:51.46
Average shared text size (kbytes): 0
Average unshared data size (kbytes): 0
Average stack size (kbytes): 0
Average total size (kbytes): 0
Maximum resident set size (kbytes): 14491536
Average resident set size (kbytes): 0
Major (requiring I/O) page faults: 0
Minor (reclaiming a frame) page faults: 3630620
Voluntary context switches: 3
Involuntary context switches: 637
Swaps: 0
File system inputs: 0
File system outputs: 0
Socket messages sent: 0
Socket messages received: 0
Signals delivered: 0
Page size (bytes): 4096
Exit status: 0
Command terminated by signal 11
Command being timed: "timeout 1280 /home/mcc/BenchKit/bin/verifypn-linux64 -s DFS -d 100 -q 100 -p ./model.pnml ./CTLFireability.xml -x 3,5,7,8,11,12,13,14,16"
User time (seconds): 119.62
System time (seconds): 5.52
Percent of CPU this job got: 99%
Elapsed (wall clock) time (h:mm:ss or m:ss): 2:05.22
Average shared text size (kbytes): 0
Average unshared data size (kbytes): 0
Average stack size (kbytes): 0
Average total size (kbytes): 0
Maximum resident set size (kbytes): 14499424
Average resident set size (kbytes): 0
Major (requiring I/O) page faults: 0
Minor (reclaiming a frame) page faults: 3625486
Voluntary context switches: 3
Involuntary context switches: 349
Swaps: 0
File system inputs: 0
File system outputs: 0
Socket messages sent: 0
Socket messages received: 0
Signals delivered: 0
Page size (bytes): 4096
Exit status: 0
Sequence of Actions to be Executed by the VM
This is useful if one wants to reexecute the tool in the VM from the submitted image disk.
set -x
# this is for BenchKit: configuration of major elements for the test
export BK_INPUT="GPPP-PT-C0100N0000000100"
export BK_EXAMINATION="CTLFireability"
export BK_TOOL="tapaal"
export BK_RESULT_DIR="/tmp/BK_RESULTS/OUTPUTS"
export BK_TIME_CONFINEMENT="3600"
export BK_MEMORY_CONFINEMENT="16384"
# this is specific to your benchmark or test
export BIN_DIR="$HOME/BenchKit/bin"
# remove the execution directoty if it exists (to avoid increse of .vmdk images)
if [ -d execution ] ; then
rm -rf execution
fi
tar xzf /home/mcc/BenchKit/INPUTS/GPPP-PT-C0100N0000000100.tgz
mv GPPP-PT-C0100N0000000100 execution
# this is for BenchKit: explicit launching of the test
cd execution
echo "====================================================================="
echo " Generated by BenchKit 2-3254"
echo " Executing tool tapaal"
echo " Input is GPPP-PT-C0100N0000000100, examination is CTLFireability"
echo " Time confinement is $BK_TIME_CONFINEMENT seconds"
echo " Memory confinement is 16384 MBytes"
echo " Number of cores is 4"
echo " Run identifier is r029-blw3-149440265800535"
echo "====================================================================="
echo
echo "--------------------"
echo "content from stdout:"
echo
echo "=== Data for post analysis generated by BenchKit (invocation template)"
echo
if [ "CTLFireability" = "UpperBounds" ] ; then
echo "The expected result is a vector of positive values"
echo NUM_VECTOR
elif [ "CTLFireability" != "StateSpace" ] ; then
echo "The expected result is a vector of booleans"
echo BOOL_VECTOR
else
echo "no data necessary for post analysis"
fi
echo
if [ -f "CTLFireability.txt" ] ; then
echo "here is the order used to build the result vector(from text file)"
for x in $(grep Property CTLFireability.txt | cut -d ' ' -f 2 | sort -u) ; do
echo "FORMULA_NAME $x"
done
elif [ -f "CTLFireability.xml" ] ; then # for cunf (txt files deleted;-)
echo echo "here is the order used to build the result vector(from xml file)"
for x in $(grep '
echo "FORMULA_NAME $x"
done
fi
echo
echo "=== Now, execution of the tool begins"
echo
echo -n "BK_START "
date -u +%s%3N
echo
timeout -s 9 $BK_TIME_CONFINEMENT bash -c "/home/mcc/BenchKit/BenchKit_head.sh 2> STDERR ; echo ; echo -n \"BK_STOP \" ; date -u +%s%3N"
if [ $? -eq 137 ] ; then
echo
echo "BK_TIME_CONFINEMENT_REACHED"
fi
echo
echo "--------------------"
echo "content from stderr:"
echo
cat STDERR ;